
Browse by Stream
-
Engineering and Architecture
Exams
Colleges
Predictors
Resources
-
Computer Application and IT
Quick Links
Colleges
-
Pharmacy
Colleges
Resources
-
Hospitality and Tourism
Colleges
Resources
Diploma Colleges
-
Competition
Other Exams
Resources
-
School
Exams
Ranking
Products & Resources
-
Study Abroad
Top Countries
Student Visas
-
Arts, Commerce & Sciences
Exams
Colleges
Upcoming Events
Resources
-
Management and Business Administration
Exams
Colleges & Courses
Predictors
-
Learn
Online Courses
Engineering Preparation
Medical Preparation
-
Online Courses and Certifications
Top Streams
Specializations
- Digital Marketing Certification Courses
- Cyber Security Certification Courses
- Artificial Intelligence Certification Courses
- Business Analytics Certification Courses
- Data Science Certification Courses
- Cloud Computing Certification Courses
- Machine Learning Certification Courses
- View All Certification Courses
Resources
-
Medicine and Allied Sciences
Colleges
Predictors
Resources
-
Law
Resources
Colleges
-
Animation and Design
Animation Courses
Colleges
Resources
-
Media, Mass Communication and Journalism
Exams
Colleges
Resources
-
Finance & Accounts
Top Courses & Careers
Colleges
Get Answers to all your Questions


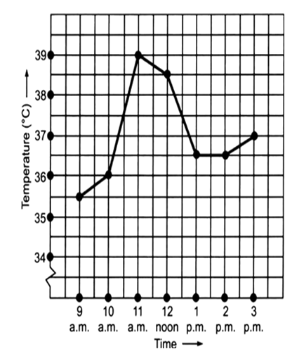
Q.1 The following graph shows the temperature of a patient in a hospital recorded every hour.
Answers (1)

(c) The patients temperature was the same two times during the period given these two times are 1 p.m. and 2 p.m.
View full answer
Similar Questions
Trending Articles/News

Latest Question
- A sum of money under compound interest doubles itself in 4 years. In how many years will it become 16 times itself? Option: 1 1
- A certain loan amounts, under compound interest, compounded annually earns an interest of Rs.1980 in the second year and Rs.2178 in the third year. How much interest did it earn in the first year?
