
Browse by Stream
-
Engineering and Architecture
Exams
Colleges
Predictors
Resources
-
Computer Application and IT
Quick Links
Colleges
-
Pharmacy
Colleges
Resources
-
Hospitality and Tourism
Colleges
Resources
Diploma Colleges
-
Competition
Other Exams
Resources
-
School
Exams
Ranking
Products & Resources
-
Study Abroad
Top Countries
Student Visas
-
Arts, Commerce & Sciences
Exams
Colleges
Upcoming Events
Resources
-
Management and Business Administration
Exams
Colleges & Courses
Predictors
-
Learn
Online Courses
Engineering Preparation
Medical Preparation
-
Online Courses and Certifications
Top Streams
Specializations
- Digital Marketing Certification Courses
- Cyber Security Certification Courses
- Artificial Intelligence Certification Courses
- Business Analytics Certification Courses
- Data Science Certification Courses
- Cloud Computing Certification Courses
- Machine Learning Certification Courses
- View All Certification Courses
Resources
-
Medicine and Allied Sciences
Colleges
Predictors
Resources
-
Law
Resources
Colleges
-
Animation and Design
Animation Courses
Colleges
Resources
-
Media, Mass Communication and Journalism
Exams
Colleges
Resources
-
Finance & Accounts
Top Courses & Careers
Colleges
Get Answers to all your Questions


- Home
- Engineering
- Solve! - Electromagnetic Induction and Alternating currents - BITSAT
- #Physics
- #Electromagnetic Induction and Alternating currents
- #Birla Institute of Technology & Science Admission Test
- #AIIMS MBBS
- #Joint Entrance Examination Main
- #Engineering
- #All India Pre Medical Test

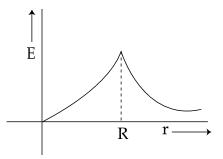
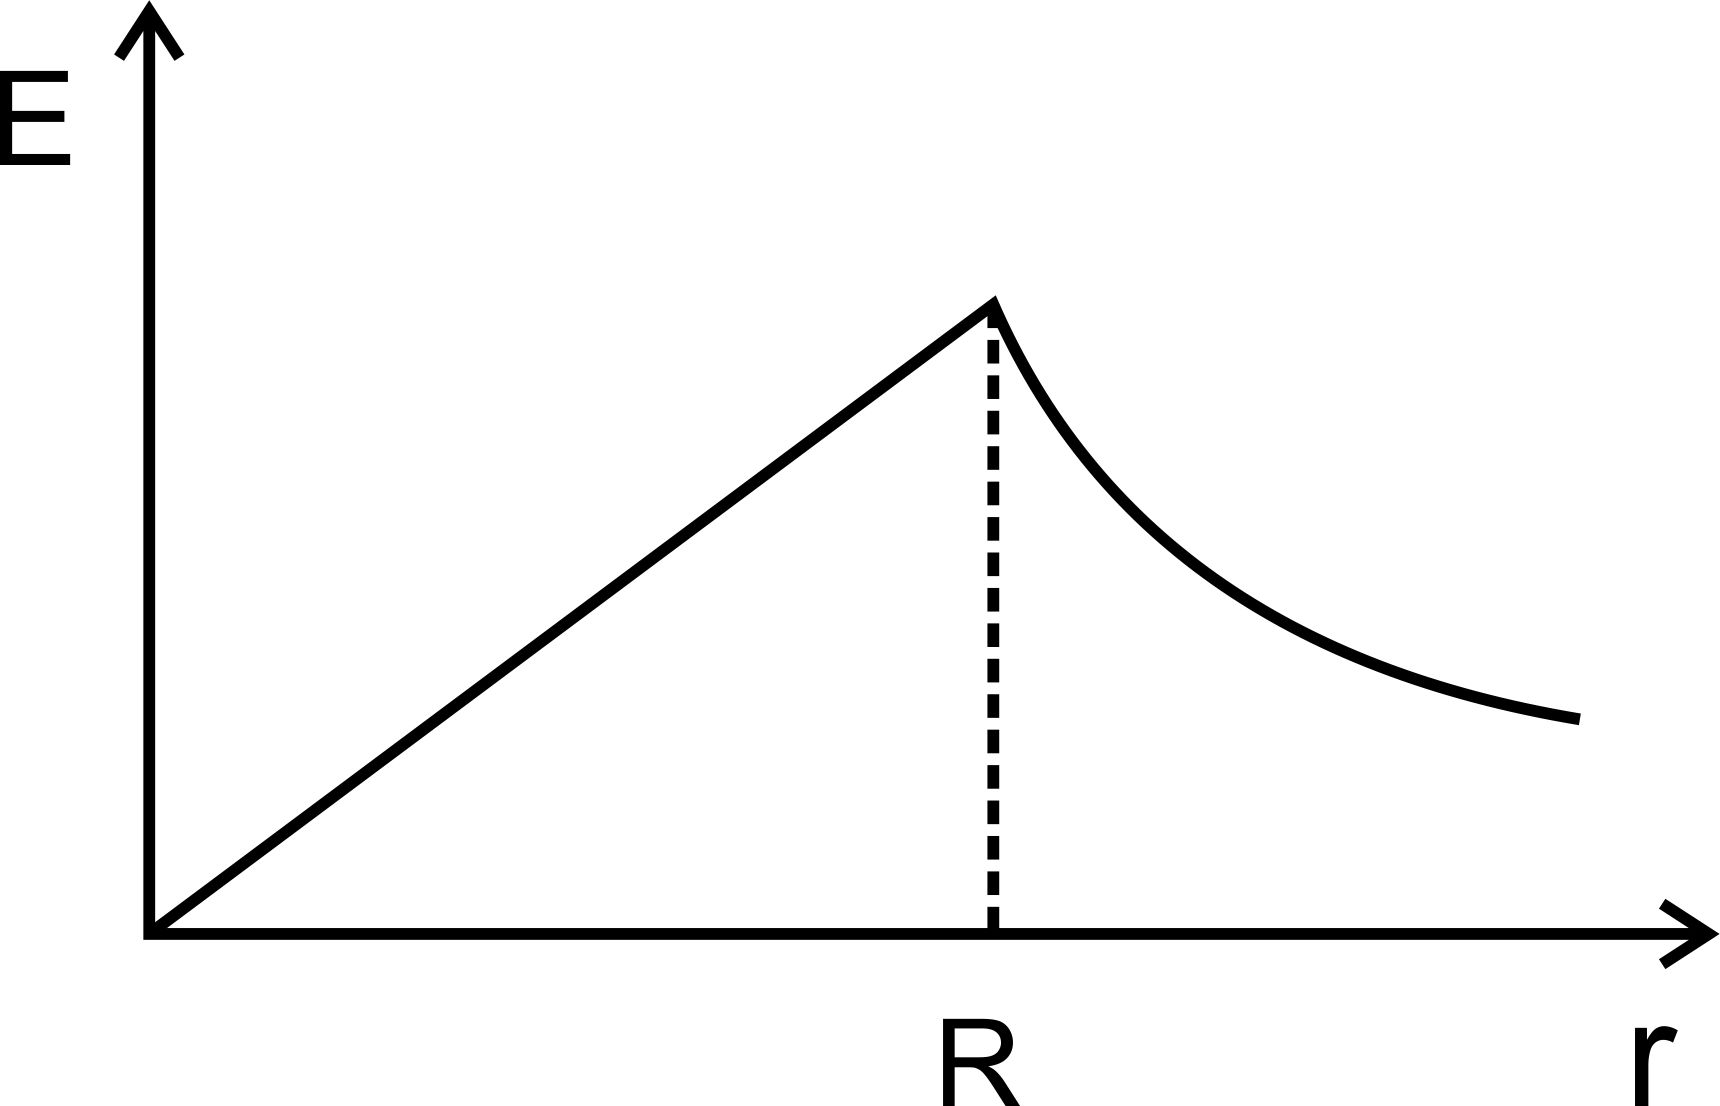
Figure shows a circular area of radius R where a uniform magnetic field is going into the plane of paper and increasing in magnitude at a constant rate. In that case, which of the following graphs, drawn schematically, correctly shows the variation of the induced electric field E(r) ?
- Option 1)

- Option 2)

- Option 3)

- Option 4)
Answers (1)

As we discussed in concept
Induced electric field -
When
A constant
B Varying
- wherein

Option 1)
Option 2)
Option 3)
Option 4)
View full answer
JEE Main high-scoring chapters and topics
Study 40% syllabus and score up to 100% marks in JEE
Similar Questions
Trending Articles/News

Latest Question
- A sum of money under compound interest doubles itself in 4 years. In how many years will it become 16 times itself? Option: 1 1
- A certain loan amounts, under compound interest, compounded annually earns an interest of Rs.1980 in the second year and Rs.2178 in the third year. How much interest did it earn in the first year?
