Apply to Aakash iACST Scholarship Test 2024
NCERT solutions for class 10 maths chapter 14 Statistics Excercise: 14.1
Which method did you use for finding the mean, and why?
Answer:
Number of plants | Number of houses | Classmark | |
0-2 | 1 | 1 | 1 |
2-4 | 2 | 3 | 6 |
4-6 | 1 | 5 | 5 |
6-8 | 5 | 7 | 35 |
8-10 | 6 | 9 | 54 |
10-12 | 2 | 11 | 22 |
12-14 | 3 | 13 | 39 |
=20 | =162 |
Mean,
We used the direct method in this as the values of are small.
Q2 Consider the following distribution of daily wages of 50 workers of a factory. Find the mean daily wages of the workers of the factory by using an appropriate method.
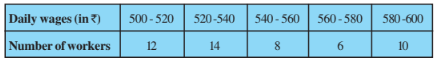
Answer:
Let the assumed mean be a = 550
Daily Wages | Number of workers | Classmark | | |
500-520 | 12 | 510 | -40 | -480 |
520-540 | 14 | 530 | -20 | -280 |
540-560 | 8 | 550 | 0 | 0 |
560-580 | 6 | 570 | 20 | 120 |
580-600 | 10 | 590 | 40 | 400 |
=50 | =-240 |
Mean,
Therefore, the mean daily wages of the workers of the factory is Rs. 545.20
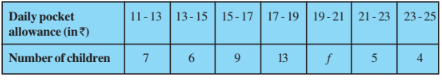
Answer:
Daily pocket allowance | Number of children | Classmark | |
11-13 | 7 | 12 | 84 |
13-15 | 6 | 14 | 84 |
15-17 | 9 | 16 | 144 |
17-19 | 13 | 18 | 234 |
19-21 | f | 20 | 20f |
21-23 | 5 | 22 | 110 |
23-25 | 4 | 24 | 96 |
=44+f | =752+20f |
Mean,
Therefore the missing f = 20
Q4 Thirty women were examined in a hospital by a doctor and the number of heartbeats per minute was recorded and summarised as follows. Find the mean heartbeats per minute for these women, choosing a suitable method.
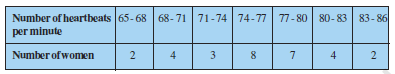
Answer:
Let the assumed mean be a = 75.5
No. of heartbeats per minute | Number of women | Classmark | | |
65-68 | 2 | 66.5 | -9 | -18 |
68-71 | 4 | 69.5 | -6 | -24 |
71-74 | 3 | 72.5 | -3 | -9 |
74-77 | 8 | 75.5 | 0 | 0 |
77-80 | 7 | 78.5 | 3 | 21 |
80-83 | 4 | 81.5 | 6 | 24 |
83-86 | 2 | 84.5 | 9 | 18 |
=30 | =12 |
Mean,
Therefore, the mean heartbeats per minute of these women are 75.9
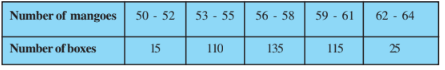
Find the mean number of mangoes kept in a packing box. Which method of finding the mean did you choose?
Answer:
Let the assumed mean be a = 57
Number of mangoes | Number of boxes | Classmark | | |
50-52 | 15 | 51 | -6 | -90 |
53-55 | 110 | 54 | -3 | -330 |
56-58 | 135 | 57 | 0 | 0 |
59-61 | 115 | 60 | 3 | 345 |
62-64 | 25 | 63 | 6 | 150 |
=400 | =75 |
Mean,
Therefore, the mean number of mangoes kept in a packing box is approx 57.19
Q6 The table below shows the daily expenditure on the food of 25 households in a locality. Find the mean daily expenditure on food by a suitable method.
Daily expenditure in rupees | 100-150 | 150-200 | 200-250 | 250-300 | 300-350 |
| Number of households | 4 | 5 | 12 | 2 | 2 |
Answer:
Let the assumed mean be a = 225 and h = 50
Daily Expenditure | Number of households | Classmark | | | |
100-150 | 4 | 125 | -100 | -2 | -8 |
150-200 | 5 | 175 | -50 | -1 | -5 |
200-250 | 12 | 225 | 0 | 0 | 0 |
250-300 | 2 | 275 | 50 | 1 | 2 |
300-350 | 2 | 325 | 100 | 2 | 4 |
=25 | = -7 |
Mean,
Therefore, the mean daily expenditure on food is Rs. 211
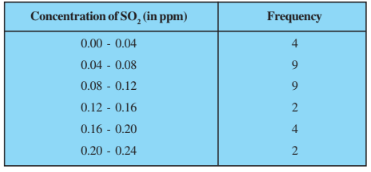
Find the mean concentration of in the air.
Answer:
Class Interval | Frequency | Classmark | |
0.00-0.04 | 4 | 0.02 | 0.08 |
0.04-0.08 | 9 | 0.06 | 0.54 |
0.08-0.12 | 9 | 0.10 | 0.90 |
0.12-0.16 | 2 | 0.14 | 0.28 |
0.16-0.20 | 4 | 0.18 | 0.72 |
0.20-0.24 | 2 | 0.22 | 0.44 |
=30 | =2.96 |
Mean,
Therefore, the mean concentration of in the air is 0.099 ppm
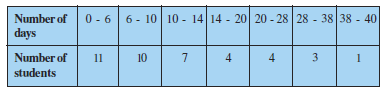
Answer:
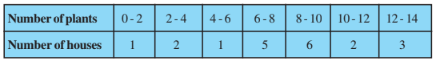
Number of days | Number of Students | Classmark | |
0-6 | 11 | 3 | 33 |
6-10 | 10 | 8 | 80 |
10-14 | 7 | 12 | 84 |
14-20 | 4 | 17 | 68 |
20-28 | 4 | 24 | 96 |
28-38 | 3 | 33 | 99 |
38-40 | 1 | 39 | 39 |
=40 | =499 |
Mean,
Therefore, the mean number of days a student was absent is 12.48 days.
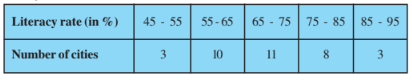
Answer:
Let the assumed mean be a = 75 and h = 10
Literacy rates | Number of cities | Classmark | | | |
45-55 | 3 | 50 | -20 | -2 | -6 |
55-65 | 10 | 60 | -10 | -1 | -10 |
65-75 | 11 | 70 | 0 | 0 | 0 |
75-85 | 8 | 80 | 10 | 1 | 8 |
85-95 | 3 | 90 | 20 | 2 | 6 |
= 35 | = -2 |
Mean,
Therefore, the mean mean literacy rate is 69.43%
NCERT solutions for class 10 maths chapter 14 Statistics Excercise: 14.2
Q1 The following table shows the ages of the patients admitted in a hospital during a year:
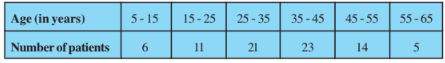
Find the mode and the mean of the data given above. Compare and interpret the two measures of central tendency.
Answer:
The class having maximum frequency is the modal class.
The maximum frequency is 23 and hence the modal class = 35-45
Lower limit (l) of modal class = 35, class size (h) = 10
Frequency ( ) of the modal class = 23, frequency (
) of class preceding the modal class = 21, frequency (
) of class succeeding the modal class = 14.
Now,
Age | Number of patients | Classmark | |
5-15 | 6 | 10 | 60 |
15-25 | 11 | 20 | 220 |
25-35 | 21 | 30 | 630 |
35-45 | 23 | 40 | 920 |
45-55 | 14 | 50 | 700 |
55-65 | 5 | 60 | 300 |
=80 | =2830 |
Mean,
The maximum number of patients are in the age group of 36.8, whereas the average age of all the patients is 35.37.
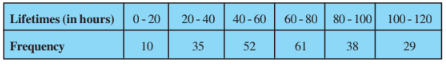
Determine the modal lifetimes of the components.
Answer:
The class having maximum frequency is the modal class.
The maximum frequency is 61 and hence the modal class = 60-80
Lower limit (l) of modal class = 60, class size (h) = 20
Frequency ( ) of the modal class = 61 frequency (
) of class preceding the modal class = 52, frequency (
) of class succeeding the modal class = 38.
Thus, the modal lifetime of 225 electrical components is 65.62 hours
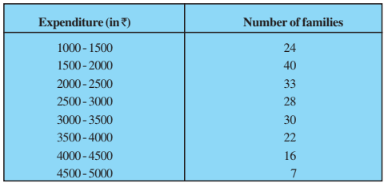
Answer:
The class having maximum frequency is the modal class.
The maximum frequency is 40 and hence the modal class = 1500-2000
Lower limit (l) of modal class = 1500, class size (h) = 500
Frequency ( ) of the modal class = 40 frequency (
) of class preceding the modal class = 24, frequency (
) of class succeeding the modal class = 33.
Thus, the Mode of the data is Rs. 1847.82
Now,
Let the assumed mean be a = 2750 and h = 500
Expenditure | Number of families | Classmark | | | |
1000-1500 | 24 | 1250 | -1500 | -3 | -72 |
1500-2000 | 40 | 1750 | -1000 | -2 | -80 |
2000-2500 | 33 | 2250 | -500 | -1 | -33 |
2500-3000 | 28 | 2750 | 0 | 0 | 0 |
3000-3500 | 30 | 3250 | 500 | 1 | 30 |
3500-4000 | 22 | 3750 | 1000 | 2 | 44 |
4000-4500 | 16 | 4250 | 1500 | 3 | 48 |
4500-5000 | 7 | 4750 | 2000 | 4 | 28 |
=200 | = -35 |
Mean,
Thus, the Mean monthly expenditure is Rs. 2662.50
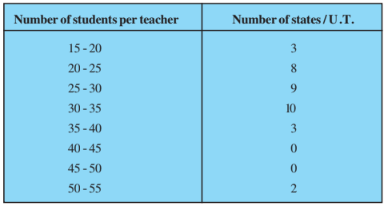
Answer:
The class having maximum frequency is the modal class.
The maximum frequency is 10 and hence the modal class = 30-35
Lower limit (l) of modal class = 30, class size (h) = 5
Frequency ( ) of the modal class = 10 frequency (
) of class preceding the modal class = 9, frequency (
) of class succeeding the modal class = 3
Thus, Mode of the data is 30.625
Now,
Let the assumed mean be a = 32.5 and h = 5
Class | Number of states | Classmark | | | |
15-20 | 3 | 17.5 | -15 | -3 | -9 |
20-25 | 8 | 22.5 | -10 | -2 | -16 |
25-30 | 9 | 27.5 | -5 | -1 | -9 |
30-35 | 10 | 32.5 | 0 | 0 | 0 |
35-40 | 3 | 37.5 | 5 | 1 | 3 |
40-45 | 0 | 42.5 | 10 | 2 | 0 |
45-50 | 0 | 47.5 | 15 | 3 | 0 |
50-55 | 2 | 52.5 | 20 | 4 | 8 |
=35 | = -23 |
Mean,
Thus, the Mean of the data is 29.22
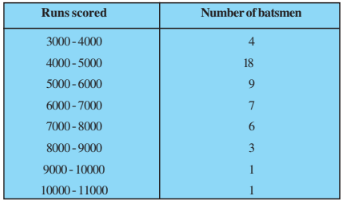
Answer:
The class having maximum frequency is the modal class.
The maximum frequency is 18 and hence the modal class = 4000-5000
Lower limit (l) of modal class = 4000, class size (h) = 1000
Frequency ( ) of the modal class = 18 frequency (
) of class preceding the modal class = 4, frequency (
) of class succeeding the modal class = 9
Thus, Mode of the data is 4608.70
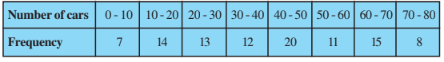
Answer:
The class having maximum frequency is the modal class.
The maximum frequency is 20 and hence the modal class = 40-50
Lower limit (l) of modal class = 40, class size (h) = 10
Frequency ( ) of the modal class = 20 frequency (
) of class preceding the modal class = 12, frequency (
) of class succeeding the modal class = 11
Thus, Mode of the data is 44.70
Statistics Class 10 Maths Chapter 14 Solution Excercise: 14.3
Answer:
Let the assumed mean be a = 130 and h = 20
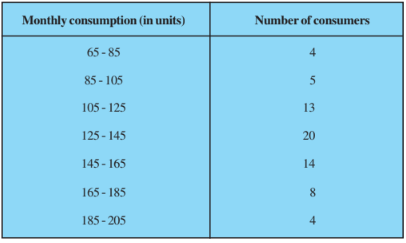
Class | Number of consumers | Cumulative Frequency | Classmark | | | |
65-85 | 4 | 4 | 70 | -60 | -3 | -12 |
85-105 | 5 | 9 | 90 | -40 | -2 | -10 |
105-125 | 13 | 22 | 110 | -20 | -1 | -13 |
125-145 | 20 | 42 | 130 | 0 | 0 | 0 |
145-165 | 14 | 56 | 150 | 20 | 1 | 14 |
165-185 | 8 | 64 | 170 | 40 | 2 | 16 |
185-205 | 4 | 68 | 190 | 60 | 3 | 12 |
= 68 | = 7 |
MEDIAN:
Median class = 125-145; Cumulative Frequency = 42; Lower limit, l = 125;
c.f. = 22; f = 20; h = 20
Thus, the median of the data is 137
MODE:
The class having maximum frequency is the modal class.
The maximum frequency is 20 and hence the modal class = 125-145
Lower limit (l) of modal class = 125, class size (h) = 20
Frequency ( ) of the modal class = 20; frequency (
) of class preceding the modal class = 13, frequency (
) of class succeeding the modal class = 14.
Thus, Mode of the data is 135.76
MEAN:
Mean,
Thus, the Mean of the data is 137.05
Q2 If the median of the distribution given below is 28.5, find the values of x and y.
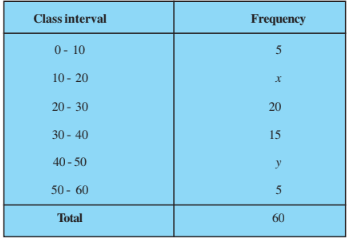
Answer:
Class | Number of consumers | Cumulative Frequency |
0-10 | 5 | 5 |
10-20 | x | 5+x |
20-30 | 20 | 25+x |
30-40 | 15 | 40+x |
40-50 | y | 40+x+y |
50-60 | 5 | 45+x+y |
= 60 |
Now,
Given median = 28.5 which lies in the class 20-30
Therefore, Median class = 20-30
Frequency corresponding to median class, f = 20
Cumulative frequency of the class preceding the median class, c.f. = 5 + x
Lower limit, l = 20; Class height, h = 10
Also,
Therefore, the required values are: x=8 and y=7
Answer:
Class | Frequency | Cumulative Frequency |
15-20 | 2 | 2 |
20-25 | 4 | 6 |
25-30 | 18 | 24 |
30-35 | 21 | 45 |
35-40 | 33 | 78 |
40-45 | 11 | 89 |
45-50 | 3 | 92 |
50-55 | 6 | 98 |
55-60 | 2 | 100 |
Therefore, Median class = 35-45
Frequency corresponding to median class, f = 21
Cumulative frequency of the class preceding the median class, c.f. = 24
Lower limit, l = 35; Class height, h = 10
Thus, the median age is 35.75 years.
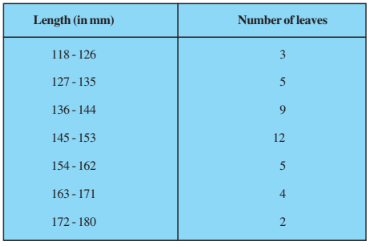
Find the median length of the leaves.
(Hint: The data needs to be converted to continuous classes for finding the median since the formula assumes continuous classes. The classes then change to
117.5 - 126.5, 126.5 - 135.5, . . ., 171.5 - 180.5.)
Answer:
The data needs to be converted to continuous classes for finding the median since the formula assumes continuous classes.
Class | Frequency | Cumulative Frequency |
117.5-126.5 | 3 | 3 |
126.5-135.5 | 5 | 8 |
135.5-144.5 | 9 | 17 |
144.5-153.5 | 12 | 29 |
153.5-162.5 | 5 | 34 |
162.5-171.5 | 4 | 38 |
171.5-180.5 | 2 | 40 |
Therefore, Median class = 144.5-153.5
Lower limit, l = 144.5; Class height, h = 9
Frequency corresponding to median class, f = 12
Cumulative frequency of the class preceding the median class, c.f. = 17
Thus, the median length of the leaves is 146.75 mm
Q5 The following table gives the distribution of the lifetime of 400 neon lamps :
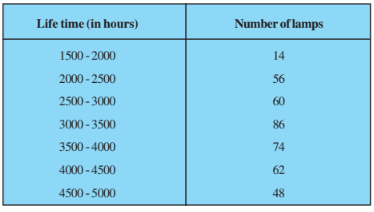 Find the median lifetime of a lamp.
Answer:
Class | Frequency | Cumulative Frequency |
1500-2000 | 14 | 14 |
2000-2500 | 56 | 70 |
2500-3000 | 60 | 130 |
3000-3500 | 86 | 216 |
3500-4000 | 74 | 290 |
4000-4500 | 62 | 352 |
4500-5000 | 48 | 400 |
Therefore, Median class = 3000-3500
Lower limit, l = 3000; Class height, h = 500
Frequency corresponding to median class, f = 86
Cumulative frequency of the class preceding the median class, c.f. = 130

Thus, the median lifetime of a lamp is 3406.97 hours
Thus, the median length of the leaves is 146.75 mm
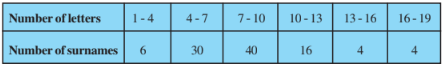
Answer:
Class | Number of surnames | Cumulative Frequency | Classmark | |
1-4 | 6 | 6 | 2.5 | 15 |
4-7 | 30 | 36 | 5.5 | 165 |
7-10 | 40 | 76 | 8.5 | 340 |
10-13 | 16 | 92 | 11.5 | 184 |
13-16 | 4 | 96 | 14.5 | 51 |
16-19 | 4 | 100 | 17.5 | 70 |
= 100 | = 825 |
MEDIAN:
Median class = 7-10; Lower limit, l = 7;
Cumulative frequency of preceding class, c.f. = 36; f = 40; h = 3
Thus, the median of the data is 8.05
MODE:
The class having maximum frequency is the modal class.
The maximum frequency is 40 and hence the modal class = 7-10
Lower limit (l) of modal class = 7, class size (h) = 3
Frequency ( ) of the modal class = 40; frequency (
) of class preceding the modal class = 30, frequency (
) of class succeeding the modal class = 16
Thus, Mode of the data is 7.88
MEAN:
Mean,
Thus, the Mean of the data is 8.25
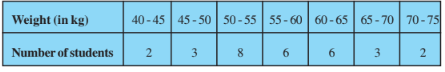
Answer:
Class | Number of students | Cumulative Frequency |
40-45 | 2 | 2 |
45-50 | 3 | 5 |
50-55 | 8 | 13 |
55-60 | 6 | 19 |
60-65 | 6 | 25 |
65-70 | 3 | 28 |
70-75 | 2 | 30 |
MEDIAN:
Median class = 55-60; Lower limit, l = 55;
Cumulative frequency of preceding class, c.f. = 13; f = 6; h = 5
Thus, the median weight of the student is 56.67 kg
1
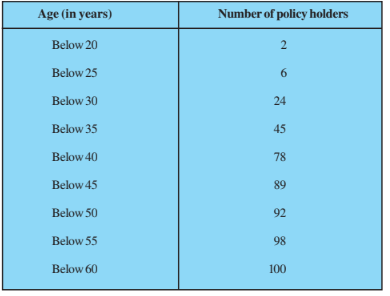
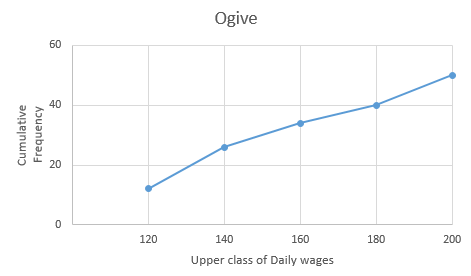
Q1.The following distribution gives the daily income of 50 workers of a factory.
Answer:
Daily Income (Upper-Class Limit) | Cumulative Frequency |
Less than 120 | 12 |
Less than 140 | 26 |
Less than 160 | 34 |
Less than 180 | 40 |
Less than 200 | 50 |
Now,
Taking upper-class interval on the x-axis and their respective frequencies on the y-axis,
Q2
Answer:
Taking upper-class interval on the x-axis and their respective frequencies on the y-axis,
Marking a point on the curve whose ordinate is 17.5 gives an x-ordinate= 46.5.
Hence, the Median of the data is 46.5
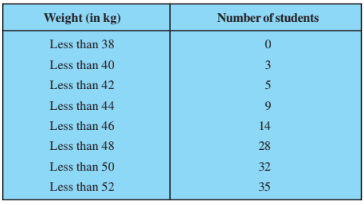
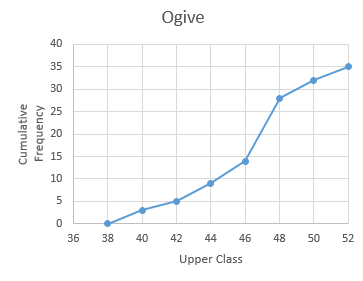
Now,
Weight (Class) | Frequency | Cumulative Frequency |
>38 | 0 | 0 |
38-40 | 3 | 3 |
40-42 | 2 | 5 |
42-44 | 4 | 9 |
44-46 | 5 | 14 |
46-48 | 14 | 28 |
48-50 | 4 | 32 |
50-52 | 3 | 35 |
Median class = 46-48; Lower limit, l = 46;
Cumulative frequency of preceding class, c.f. = 14; f = 14; h = 2
Thus, the median using formula is 46.5 which verifies the result.
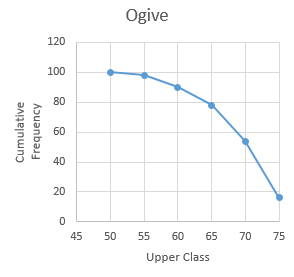
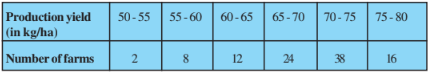 Change the distribution to a more than type distribution, and draw its ogive.
 Answer:
Production yield (Upper-Class Limit) | Cumulative Frequency |
More than or equal to 50 | 100 |
More than or equal to 55 | 98 |
More than or equal to 60 | 90 |
More than or equal to 65 | 78 |
More than or equal to 70 | 54 |
More than or equal to 75 | 16 |
Now,
Taking lower class limit on the x-axis and their respective frequencies on the y-axis,