
Browse by Stream
-
Engineering and Architecture
Exams
Colleges
Predictors
Resources
-
Computer Application and IT
Quick Links
Colleges
-
Pharmacy
Colleges
Resources
-
Hospitality and Tourism
Colleges
Resources
Diploma Colleges
-
Competition
Other Exams
Resources
-
School
Exams
Top Schools
Products & Resources
-
Study Abroad
Top Countries
Resources
-
Arts, Commerce & Sciences
Colleges
Upcoming Events
Resources
-
Management and Business Administration
Exams
Colleges & Courses
Predictors
-
Learn
Law Preparation
MBA Preparation
Engineering Preparation
Medical Preparation
-
Online Courses and Certifications
Top Streams
Specializations
- Digital Marketing Certification Courses
- Cyber Security Certification Courses
- Artificial Intelligence Certification Courses
- Business Analytics Certification Courses
- Data Science Certification Courses
- Cloud Computing Certification Courses
- Machine Learning Certification Courses
- View All Certification Courses
Resources
-
Medicine and Allied Sciences
Colleges
Predictors
Resources
-
Law
Resources
Colleges
-
Animation and Design
Exams
Predictors & Articles
Colleges
Resources
-
Media, Mass Communication and Journalism
Colleges
Resources
-
Finance & Accounts
Top Courses & Careers
Colleges
Get Answers to all your Questions


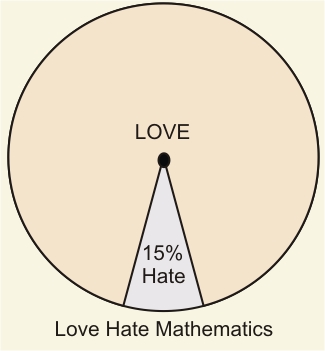
1. Each of the following pie charts (Fig 5.5) gives you a different piece of information about your class. Find the fraction of the circle representing each of these information.
(iii).
Answers (1)

(iii)
The circle represents that students love and
students hate Mathematics
of the circle represents the students who love mathematics and
of the circle represents the students who hate mathematics.
View full answer

