
-
Engineering and Architecture
Exams
Colleges
Predictors
Resources
-
Computer Application and IT
Quick Links
Colleges
-
Pharmacy
Colleges
Resources
-
Hospitality and Tourism
Colleges
Resources
Diploma Colleges
-
Competition
Other Exams
Resources
-
School
Exams
Top Schools
Products & Resources
-
Study Abroad
Top Countries
Resources
-
Arts, Commerce & Sciences
Exams
Colleges
Upcoming Events
Resources
-
Management and Business Administration
Colleges & Courses
Predictors
-
Learn
Law Preparation
MBA Preparation
Engineering Preparation
Medical Preparation
-
Online Courses and Certifications
Top Streams
Specializations
- Digital Marketing Certification Courses
- Cyber Security Certification Courses
- Artificial Intelligence Certification Courses
- Business Analytics Certification Courses
- Data Science Certification Courses
- Cloud Computing Certification Courses
- Machine Learning Certification Courses
- View All Certification Courses
Resources
-
Medicine and Allied Sciences
Colleges
Predictors
Resources
-
Law
Resources
Colleges
-
Animation and Design
Exams
Predictors & Articles
Colleges
Resources
-
Media, Mass Communication and Journalism
Colleges
Resources
-
Finance & Accounts
Top Courses & Careers
Colleges
Get Answers to all your Questions


- Home
- Engineering
- how to cheak ellingum diagram
How to check ellingum diagram?
Answers (1)
Gibbs equation helps us to predict the spontaneity of a reaction on the basis of enthalpy and entropy values directly. H.G.T Ellingham proposed the Ellingham diagram to predict the spontaneity of reduction of various metal oxides. Ellingham diagram was basically a curve which related the Gibbs energy value with the temperature. Gibbs energy is given as:
ΔG = ΔH – TΔS
Where ΔH is the change in enthalpy and ΔS is the change in entropy.
With respect to a reaction, Gibbs energy can be related to the equilibrium constant as:
ΔGo= – RTlnK
Where K is the equilibrium constant.
Thus, when the reaction is exothermic, enthalpy of the system is negative, thus making Gibbs free energy negative. Hence, we can say that the reaction will proceed in the forward direction due to a positive value of the equilibrium constant. This law can be scaled for two different reactions taking place in a system too. The overall reaction (combination of two reactions) will occur if and only if net ΔG (sum of ΔG’s of both the reactions) of the two possible reactions is negative.
An Ellingham diagram is a plot of ΔG versus temperature for different reactions. For example,
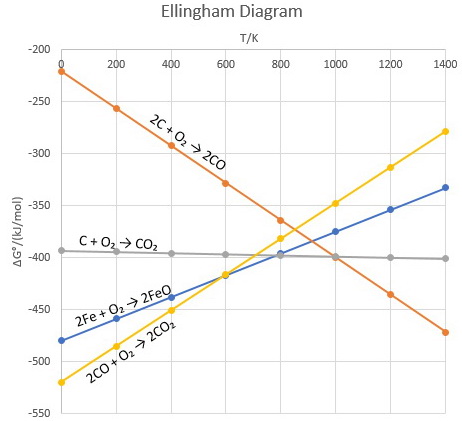
Thus, it is possible to predict the temperature above which, say, carbon or carbon monoxide will reduce any metal oxide, for example FeO.
Below 600 K, only CO reduces FeO.
Above 800 K, reduction by conversion of coke to carbon dioxide is spontaneous.
Above 900 K, reduction by conversion of coke to carbon monoxide is spontaneous.
Thus, for the reduction of FeO, carbon monoxide is the better reducing agent below 600 K, but carbon is the better reducing agent above 800 K.
