
Browse by Stream
-
Engineering and Architecture
Exams
Colleges
Predictors
Resources
-
Computer Application and IT
Quick Links
Colleges
-
Pharmacy
Colleges
Resources
-
Hospitality and Tourism
Colleges
Resources
Diploma Colleges
-
Competition
Other Exams
Resources
-
School
Exams
Top Schools
Products & Resources
-
Study Abroad
Top Countries
Resources
-
Arts, Commerce & Sciences
Colleges
Upcoming Events
Resources
-
Management and Business Administration
Exams
Colleges & Courses
Predictors
-
Learn
Law Preparation
MBA Preparation
Engineering Preparation
Medical Preparation
-
Online Courses and Certifications
Top Streams
Specializations
- Digital Marketing Certification Courses
- Cyber Security Certification Courses
- Artificial Intelligence Certification Courses
- Business Analytics Certification Courses
- Data Science Certification Courses
- Cloud Computing Certification Courses
- Machine Learning Certification Courses
- View All Certification Courses
Resources
-
Medicine and Allied Sciences
Colleges
Predictors
Resources
-
Law
Resources
Colleges
-
Animation and Design
Exams
Predictors & Articles
Colleges
Resources
-
Media, Mass Communication and Journalism
Colleges
Resources
-
Finance & Accounts
Top Courses & Careers
Colleges
Get Answers to all your Questions


- Home
- Engineering
- In a P-V diagram for an ideal gas for different process is as shown . In graph curve OR represents <img alt="" src="https://cdn.entrance360.com/media/uploads/2018/08/03/21768.jpg" s
In a P-V diagram for an ideal gas for different process is as shown . In graph curve OR represents

Option: 1
Isochoric process
Option: 2
Isothermal process
Option: 3
Isobaric process
Option: 4
Adiabatic process
Answers (1)

As we have learned
Indicator Diagram for Adiabatic Process -
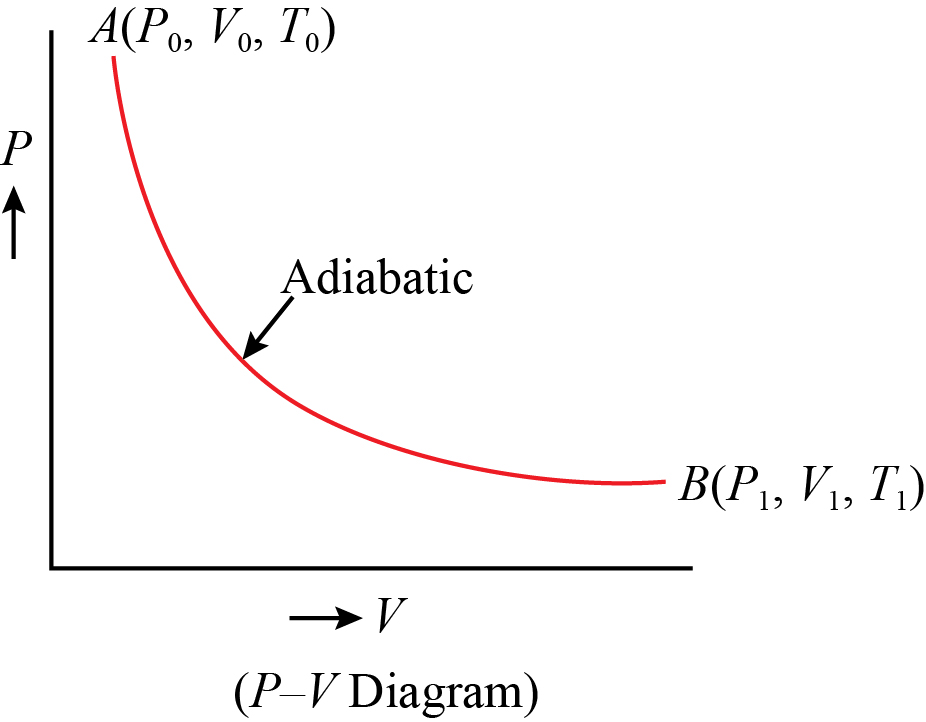
- wherein
Similar to Isothermal process but slope is more.
Curve OR represents adiabatic process
OP represents --> isobaric
OS represents --> isochoric
OQ represents --> isothermal
OR steeper than OQ
View full answer
