-
Engineering and Architecture
Exams
Colleges
Predictors
Resources
-
Computer Application and IT
Quick Links
Colleges
-
Pharmacy
Colleges
Resources
-
Hospitality and Tourism
Colleges
Resources
Diploma Colleges
-
Competition
Other Exams
Resources
-
School
Exams
Top Schools
Products & Resources
-
Study Abroad
Top Countries
Resources
-
Arts, Commerce & Sciences
Colleges
Upcoming Events
Resources
-
Management and Business Administration
Exams
Colleges & Courses
Predictors
-
Learn
Law Preparation
MBA Preparation
Engineering Preparation
Medical Preparation
-
Online Courses and Certifications
Top Streams
Specializations
- Digital Marketing Certification Courses
- Cyber Security Certification Courses
- Artificial Intelligence Certification Courses
- Business Analytics Certification Courses
- Data Science Certification Courses
- Cloud Computing Certification Courses
- Machine Learning Certification Courses
- View All Certification Courses
Resources
-
Medicine and Allied Sciences
Colleges
Predictors
Resources
-
Law
Resources
Colleges
-
Animation and Design
Exams
Predictors & Articles
Colleges
Resources
-
Media, Mass Communication and Journalism
Colleges
Resources
-
Finance & Accounts
Top Courses & Careers
Colleges
Kinematics graphs - (Concept)
I. Position time graph-
The motion of an object can be represented by a position-time graph.
Such a graph is very useful to analyze different aspects of the motion of an object.
The slope of the position-time graph represents the velocity of the particle
-
Position time graph when the body is at rest

Figure-1 shows position time graph when the body is at rest
Position time graph for stationary object is straight line parallel to time axis.
-
Position time graph for uniform motion

Figure-2 shows position time graph for uniform motion.
Here the object is moving along a straight line and covers equal distances in equal intervals of time.
-
Position – time graph For an object in non-uniform motion


The figure-3,4 shows a position-time graph for non-uniform motion.
In figure-3, acceleration is positive and in Figure-4, acceleration is negative.
Here object is moving along straight Line and covers equal distance in unequal time interval.
II. Velocity Time Graph
The graph is plotted by taking time t along x-axis and velocity of the particle on y-axis.
-
The area of the velocity v/s time graph for the particular time interval gives the displacement and distance travelled by the body for a given time interval.
-
Slope of velocity-time graph represents the acceleration of the particle.
-
When particle is moving with constant velocity.

Figure-5 shows constant velocity and zero acceleration.
-
For uniform acceleration of the particle

Figure-6 shows constant positive acceleration.
III. Acceleration-Time graph
The graph is plotted by taking time t along x-axis and acceleration of the particle on y-axis.
-
The area of the acceleration v/s time graph for the particular time interval gives the change in velocity of the body for a given time interval.
-
Slope of the acceleration-time graph represents the jerk.
-
When particle having Constant acceleration

Figure-7 represents uniform positive acceleration
-
A particle having uniformly increasing acceleration

Figure-8 represents positive and uniformly increasing acceleration.
| Exam | Chapter |
| JEE MAIN | Kinematics |
The velocity-displacement graph describing the motion of a bicycle is shown in the figure.

The acceleration-displacement graph of the bicycle's motion is best described by :
| A. |
|
| B. |
|
| C. |
|
| D. |
|
In the given position-time graph, which of the following is correct

| A. |
|
| B. |
|
| C. |
|
| D. |
|
The figure shows the displacement time graph of two particles moving along the x-axis. We can say that.

| A. |
|
| B. |
|
| C. |
|
| D. |
|
A particle is moving with constant velocity along a straight line. The position time graph will look like
| A. |
|
| B. |
|
| C. |
|
| D. |
|
A particle is stationary its position time graph will look like
| A. |
|
| B. |
|
| C. |
|
| D. |
|
Position time graph of a particle with non uniform velocity is shown below. We can conclude that

| A. |
|
| B. |
|
| C. |
|
| D. |
|
The velocity-displacement graph of a particle is shown in the figure. Which of the following graphs correctly represents the variation of acceleration with displacement?

| A. |
|
| B. |
|
| C. |
|
| D. |
|
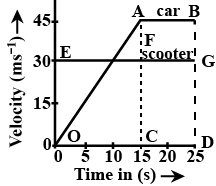
The velocity-time graphs of a car and a scooter are shown in the figure. (i) The difference between the distance traveled by the car and the scooter in 15 seconds and (ii) the time at which the car will catch up with the scooter, respectively:
| A. |
|
| B. |
|
| C. |
|
| D. |
|
All the graphs below are intended to represent the same motion. One of them does it incorrectly. Pick it up.
| A. |
|
| B. |
|
| C. |
|
| D. |
|
The velocity (v) and time (t) graph of the body in straight-line motion are shown in the figure. The point S is at 4.33 seconds. The total distance covered by the body in 6 seconds is:

| A. |
|
| B. |
|
| C. |
|
| D. |
|
A particle starts from the origin at time t=0 and moves alongs the positive x -axis. The graph of of velocity with respect to time is shown in figure. What is the position (in m) of the particle at time t= 5s?

| A. |
|
| B. |
|
| C. |
|
| D. |
|
The speed versus time graph for a particle is shown in the figure. The distance travelled (in m) by the particle during the time interval t=0 to t=5s will be______

| A. |
|
| B. |
|
| C. |
|
| D. |
|
If the velocity-time graph has the shape AMB, what would be the shape of the corresponding acceleration -time graph?

| A. |
|
| B. |
|
| C. |
|
| D. |
|
The position, velocity and acceleration of a particle moving with constant acceleration can be represented by :
| A. |
|
| B. |
|
| C. |
|
| D. |
|
A body is thrown vertically upwards. Which one of the following graphs correctly represent the velocity vs time ?
| A. |
|
| B. |
|
| C. |
|
| D. |
|
Which of the following graph represents non-uniform motion
| A. |
|
| B. |
|
| C. |
|
| D. |
|
A body is travelling in a straight line with a uniform speed. Which one of the plots represents the change in distance travelled with time
| A. |
|
| B. |
|
| C. |
|
| D. |
|
Which of the graph represents a state of rest for an object -
| A. |
|
| B. |
|
| C. |
|
| D. |
|
The body is projected vertically upwards. Which of the following graphs correctly shows the relationship between velocity and time?
| A. |
|
| B. |
|
| C. |
|
| D. |
|
Consider the following figure

Which of the following statements is true?
| A. |
|
| B. |
|
| C. |
|
| D. |
|
Position time graph of a particle is given in the figure. Its velocity (in m/s) is

| A. |
|
| B. |
|
| C. |
|
| D. |
|
The velocity time graph of a body moving in a straight line is shown in figure.

The ratio of displacement to distance traveled by the body in time $
0 \text { to } 10 \mathrm{~s}
$ is :
| A. |
|
| B. |
|
| C. |
|
| D. |
|
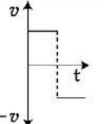
Match Column-I with Column-II :
|
Column I (x-t graphs) |
Column II (v-t graphs) |
||
| A |  |
 |
I |
| B |  |
 |
II |
| C |  |
 |
III |
| D |  |
 |
IV |
Choose the correct answer from the options given below:
| A. |
|
| B. |
|
| C. |
|
| D. |
|
Given below are two statements :
Statement I: Area under velocity- time graph gives the distance travelled by the body in a given time.
Statement II: Area under acceleration- time graph is equal to the change in velocity- in the given time. In the light of given statement, choose the correct answer from the options given below :
| A. |
|
| B. |
|
| C. |
|
| D. |
|
From the v – t graph shown, the ratio of distance to displacement in 25 s of motion is :

| A. |
|
| B. |
|
| C. |
|
| D. |
|
The figure illustrates the velocity variation of a particle moving along a straight line with respect to time. Determine the distance (in m) travelled by the particle within a duration of four seconds.

| A. |
|
| B. |
|
| C. |
|
| D. |
|
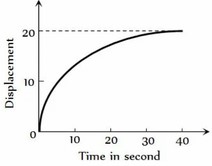
The given figure represents the displacement of a particle as a function of time. Based on the figure, we can conclude that:
| A. |
|
| B. |
|
| C. |
|
| D. |
|
Among the given options, which graph or graphs represent the velocity-time relationship of a ball during its upward flight when thrown vertically (assuming no air resistance)?
| A. |
|
| B. |
|
| C. |
|
| D. |
|
The given figure illustrates the graph depicting the relationship between displacement (x) and time (t) for a particle moving in a straight line. Based on the intervals OA, AB, BC, and CD shown on the graph, we can determine the acceleration of the particle during each interval.

| A. |
|
| B. |
|
| C. |
|
| D. |
|
The positon-time graphs for two students A and B returning from the school to their homes are shown in figure.

(A) A lives closer to the school
(B) B lives closer to the school
(C) A takes lesser time to reach home
(D) A travels faster than B
(E) B travels faster than A
Choose the correct answer from the options given below :
| A. |
|
| B. |
|
| C. |
|
| D. |
|
A body is travelling in a straight line with a uniform increasing speed. Which one of the plot represents the change in distance travelled with time
| A. |
|
| B. |
|
| C. |
|
| D. |
|
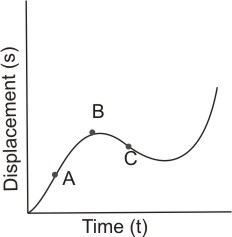
For a moving particle displacement - a time graph is shown in the given figure. The instantaneous velocity of the particle is negative at the point.
| A. |
|
| B. |
|
| C. |
|
| D. |
|
Match the following cases for a moving object
|
|
(1) Positive Acceleration |
|
|
(2) Negative Acceleration
|
 |
(3) Zero Acceleration |


| A. |
|
| B. |
|
| C. |
|
| D. |
|
Which of the following graphs represents non-uniform motion
| A. |
|
| B. |
|
| C. |
|
| D. |
|
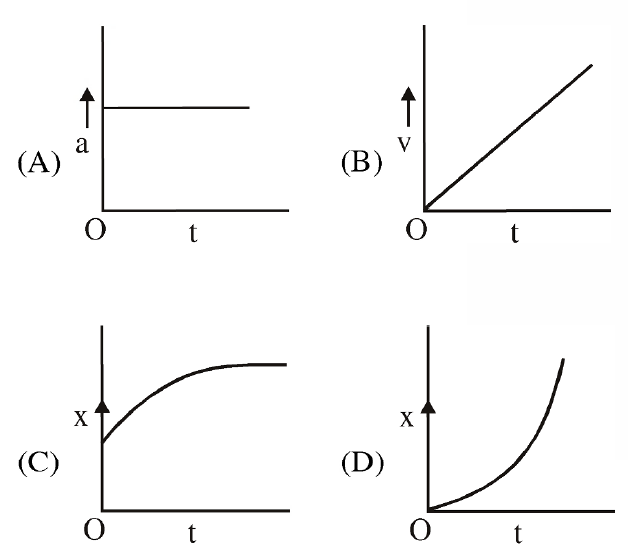
A particle starts from origin O from rest and moves with a uniform acceleration along the positive x-axis. Identify all figure that correctly represents the motion qualitatively. (a=acceleration, v=velocity,x=displacement,t=time)
| A. |
|
| B. |
|
| C. |
|
| D. |
|
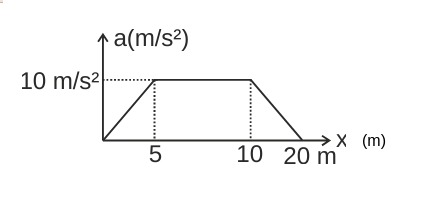
A particle starts from rest $(a t x=0)$ when an acceleration is applied to it. The acceleration of the particle changes with its coordinate as shown in the figure. Find the speed of the particle at $x=20 \mathrm{~m}$.
| A. |
|
| B. |
|
| C. |
|
| D. |
|
A wooden block, initially at rest on the ground, is pushed by a force which increases linearly with time t. Which of the following curves best describes the acceleration of the block with time :
| A. |
|
| B. |
|
| C. |
|
| D. |
|
Four velocity time graphs (Namely I , II , III , IV ) are shown in the figure. In which case is the acceleration uniform and positive

| A. |
|
| B. |
|
| C. |
|
| D. |
|
A body is at rest at $x=0$. At $t=0$, it starts moving in the positive $ x$ direction with a constant acceleration. At the same instant, another body passes through $x=0$ moving in the positive $x$-direction with a constant speed. The position of the first body is given by $x_1(t)$ after time $t$ and that of the second body by $x_2(t)$ after the same time interval. Which of the following graphs correctly describes $\left(x_1-x_2\right)$ as a function of time $t$?
| A. |
|
| B. |
|
| C. |
|
| D. |
|
What are the essential elements of graphs?
- Point
- The slope of the curve
- Area under curve
| A. |
|
| B. |
|
| C. |
|
| D. |
|
What is the area of the region bounded by y = 2x, y = 0, x = 0 and x = 2 ?
| A. |
|
| B. |
|
| C. |
|
| D. |
|
Which graph corresponds to an object moving with a constant negative acceleration and a positive velocity?
| A. |
|
| B. |
|
| C. |
|
| D. |
|
Which of the following graphs is used for determining the instantaneous velocity from the slope?
| A. |
|
| B. |
|
| C. |
|
| D. |
|
The Velocity -time graph for two bodies A and B are below

Then the acceleration of A and B are in the ratio of :-
| A. |
|
| B. |
|
| C. |
|
| D. |
|
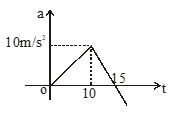
For the following graph, select the correct option(s):
| A. |
|
| B. |
|
| C. |
|
| D. |
|
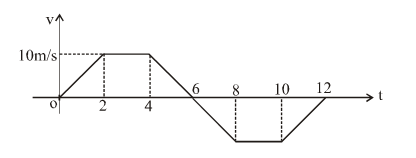
The particle is moving on the X-axis. Its velocity-time graph is as shown. Which of the following is correct?
| A. |
|
| B. |
|
| C. |
|
| D. |
|
If a ball is thrown at a velocity of $45 \mathrm{~m} / \mathrm{s}$ in a vertically upward direction, then what would be the velocity profile as a function of height? Assume $g=10 \mathrm{~m} / \mathrm{s}^2$.
| A. |
|
| B. |
|
| C. |
|
| D. |
|
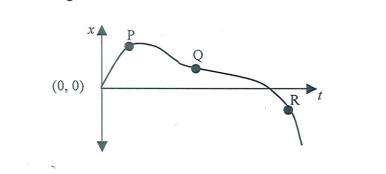
In the following displacement $(x)$ vs time $(t)$ graph, at which among the points P, Q and R is the object's speed increasing?
| A. |
|
| B. |
|
| C. |
|
| D. |
|
Among the four graphs, there is only one graph for which average velocity over the time interval (0, T) can vanish for a suitably chosen T. Which one is it?
| A. |
|
| B. |
|
| C. |
|
| D. |
|
Following are four different relations about displacement, velocity, and acceleration for the motion of a particle in general. Choose the incorrect one(s) :
(a) $V_{a v}=\frac{1}{2}\left[V\left(t_1\right)+V\left(t_2\right)\right]$
(b) $V_{a v}=\frac{r\left(t_2\right)-r\left(t_1\right)}{t_2-t_1}$
(c) $r=\frac{1}{2}\left(V\left(t_2\right)-V\left(t_1\right)\right)\left(t_2-t_1\right)$
(d) $a_{a v}=\frac{V\left(t_2\right)-V\left(t_1\right)}{t_2-t_1}$
| A. |
|
| B. |
|
| C. |
|
| D. |
|
The variation of quantity A with quantity B, plotted in Fig. 3.2 describes the motion of a particle in a straight line.

(a) Quantity B may represent time.
(b) Quantity A is velocity if motion is uniform.
(c) Quantity A is displacement if motion is uniform.
(d) Quantity A is velocity if motion is uniformly accelerated.
| A. |
|
| B. |
|
| C. |
|
| D. |
|
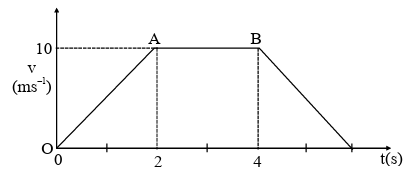
The velocity-time graph of an object moving along a straight line is shown in the figure. What is the distance covered by the object between $t=0$ to $\mathrm{t}=4 \mathrm{~s} ?$
| A. |
|
| B. |
|
| C. |
|
| D. |
|
The accompanying graph of position x versus time t represents the motion of the particle. If p and q are both positive constants, the expression that best describes the acceleration $a $ of the particle is

| A. |
|
| B. |
|
| C. |
|
| D. |
|
A pictorial representation of information which is a two-dimensional drawing explaining the relationship between dependent and independent variables is known as?
| A. |
|
| B. |
|
| C. |
|
| D. |
|
Which of the following curves possibly represent one-dimensional motion of a particle ?
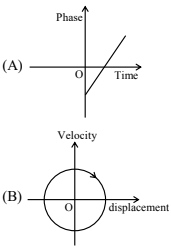
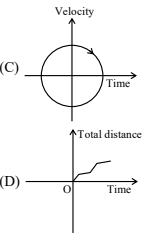
Choose the correct answer from the options given below :
| A. |
|
| B. |
|
| C. |
|
| D. |
|
The displacement $x$ versus time graph is shown below.
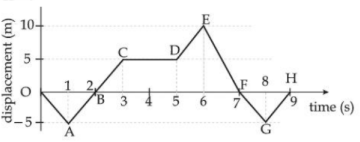
(A) The average velocity during 0 to 3 s is $10 \mathrm{~m} / \mathrm{s}$
(B) The average velocity during 3 to 5 s is $0 \mathrm{~m} / \mathrm{s}$
(C) The instantaneous velocity at $\mathrm{t}=2 \mathrm{~s}$ is $5 \mathrm{~m} / \mathrm{s}$
(D) The average velocity during 5 to 7 s and instantaneous velocity at $\mathrm{t}=6.5 \mathrm{~s}$ are equal
(E) The average velocity from $t=0$ to $t=9 \mathrm{~s}$ is zero
Choose the correct answer from the options given below
| A. |
|
| B. |
|
| C. |
|
| D. |
|
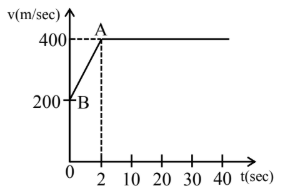
The motion of an airplane is represented by velocity-time graph as shown below. The distance covered by airplane in the first 30.5 second is ______ km.
| A. |
|
| B. |
|
| C. |
|
| D. |
|
Motion of an object can be represented by a position-time graph .
Such a graph is a powerful tool to represent and analyse different aspects of motion of an object