
-
Engineering and Architecture
Exams
Colleges
Predictors
Resources
-
Computer Application and IT
Quick Links
Colleges
-
Pharmacy
Colleges
Resources
-
Hospitality and Tourism
Colleges
Resources
Diploma Colleges
-
Competition
Other Exams
Resources
-
School
Exams
Top Schools
Products & Resources
-
Study Abroad
Top Countries
Resources
-
Arts, Commerce & Sciences
Colleges
Upcoming Events
Resources
-
Management and Business Administration
Exams
Colleges & Courses
Predictors
-
Learn
Law Preparation
MBA Preparation
Engineering Preparation
Medical Preparation
-
Online Courses and Certifications
Top Streams
Specializations
- Digital Marketing Certification Courses
- Cyber Security Certification Courses
- Artificial Intelligence Certification Courses
- Business Analytics Certification Courses
- Data Science Certification Courses
- Cloud Computing Certification Courses
- Machine Learning Certification Courses
- View All Certification Courses
Resources
-
Medicine and Allied Sciences
Colleges
Predictors
Resources
-
Law
Resources
Colleges
-
Animation and Design
Exams
Predictors & Articles
Colleges
Resources
-
Media, Mass Communication and Journalism
Colleges
Resources
-
Finance & Accounts
Top Courses & Careers
Colleges
Get Answers to all your Questions


All Questions
As the number of tosses of a coin increase, the ratio of the number of heads to the total number of tosses will be 0.5. Is it correct? If not, write the correct one.
Answer : No
As the number of tosses of a coin increase, we may have a head or a tail as an outcome. Probability of 0.5 is achieved when the total number of heads = total number of tails. So obviously we can say that it is not necessary that the favourable outcomes of tails will be equal to favourable outcomes of heads.
So this ratio may or may not be 0.5.
So we are not sure what the ratio will be.
Hence the given statement is not true.
View Full Answer(1)Can the experimental probability of an event be greater than 1? Justify your answer.
Answer : No
We know that,
As we know the value of favourable outcomes can never be greater than the total outcomes.
So the probability can never be greater than 1. The probability of an event can be between only 0 and 1.
Hence, the experimental probability of an event can never be greater than 1
View Full Answer(1)Crack CUET with india's "Best Teachers"
- HD Video Lectures
- Unlimited Mock Tests
- Faculty Support

Can the experimental probability of an event be a negative number? If not, why?
Answer: No
Probability of a number is determined by: Favourable Events / Total Events
Now, the number of trials in which the event can happen cannot be negative. So the total number of trials is always positive. Hence, the experimental probability of an event is always positive.
View Full Answer(1)30 children were asked about the number of hours they watched TV programs last week. The results are recorded as under :
| Number of hours | 0-5 | 5-10 | 10-15 | 15-20 |
| Frequency | 8 | 16 | 4 | 2 |
Can we say that the number of children who watched TV for 10 or more hours a week is 22 ? Justify your answer.
Answer : No
Total number of students, who watched TV for 10 or more hours are:
From the table:
C.I. = frequency
10-15= children
10-20 children
Total = 6 children
Hence, the total number of students who watched TV for 10 or more hours are 6 and not 22.
View Full Answer(1)JEE Main high-scoring chapters and topics
Study 40% syllabus and score up to 100% marks in JEE
The class marks of a continuous distribution are :
Is it correct to say that the last interval will be 1.55 - 1.73? Justify your answer.
Answer: As we know that class is the mid-point of a class interval.
So, Difference between two consecutive class marks is always equal to the class size.
| Class-marks | Difference |
| 1.14-1.04 | 0.1 |
| 1.24-1.14 | 0.1 |
| 1.34-1.24 | 0.1 |
| 1.44-1.34 | 0.1 |
| 1.54-1.44 | 0.1 |
| 1.55-1.73 | 0.8 |
So, we can see that the last class size is 0.8, which is not equal to the class size found previously.
Hence it cannot be the correct class interval for the given class marks.
View Full Answer(1)Is it correct to say that in a histogram, the area of each rectangle is proportional to the class size of the corresponding class interval? If not, correct the statement.
Answer: No
In a histogram, the area of each rectangle is proportional to the frequency of its class.
The frequency of a class may change for any class interval. But for a specific class, the class size will remain the same.
We know that the frequency is represented on the y-axis and class size on the x-axis.
So we can say that for all the rectangles of a histogram, width (class size) remains the same & length (frequency) changes.
Hence, the correct statement is that in a histogram, the area of each rectangle is proportional to the frequency of its class.
View Full Answer(1)NEET 2024 Most scoring concepts
- Just Study 32% of the NEET syllabus and Score up to 100% marks
A football player scored the following number of goals in the 10 matches: 1, 3, 2, 5, 8, 6, 1, 4, 7, 9
Since the number of matches is 10 (an even number), therefore, the median
Is it the correct answer and why?
Answer : [No, as the data is not arranged in ascending order before finding the middle terms]
Given terms : 1, 3, 2, 5, 8, 6, 1, 4, 7, 9
To calculate the median, arrange the given data in ascending order and then find the middle term. This middle term is called the median.
Firstly, we will arrange the data in ascending order as:
Here the total number of observations, n=10 which is even.
In case of even number of terms:
Hence, the median is 4.5
View Full Answer(1)A child says that the median of 3, 14, 18, 20, 5 is 18. What doesn’t the child understand about finding the median?
Answer: The child has not arranged the data in ascending order before finding the median
To calculate the median, arrange the given data in ascending order and then find the middle term. This middle term is called the median.
Firstly, we will arrange the given data in ascending order as,
Total number of terms = 5( odd )
(where n is the number of terms)
So the median is not 18
The child has not arranged the data in ascending order before finding the median.
View Full Answer(1)Crack CUET with india's "Best Teachers"
- HD Video Lectures
- Unlimited Mock Tests
- Faculty Support
In a diagnostic test in mathematics given to students, the following marks (out of 100) are recorded:
Which ‘average’ will be a good representative of the above data and why?
Answer: Median
Given data is :
The mode is best used with categorical data.
Mean is best used with continuous and symmetrical data.
Median is best used with skewed distributions as we can find the middle of the data set.
In ascending order, we have:
In this case,
Median will be a good representative of data, because each value occurs once, hence we can draw a line right at the middle of the data.
Hence the correct answer is median.
View Full Answer(1)The frequency distribution :
| Marks | 0-20 | 20-40 | 40-60 | 60-100 |
| Number of Students | 10 | 15 | 20 | 25 |
has been represented graphically as follows :
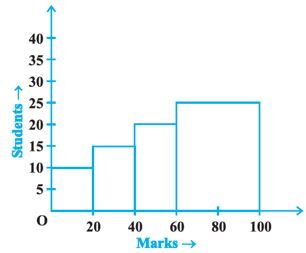
Do you think this representation is correct? Why?
Given :
| Marks | 0-20 | 20-40 | 40-60 | 60-100 |
| Number of Students | 10 | 15 | 20 | 25 |
| Class interval (x-axis) | Frequency (y-axis) |
| 0-20 | 10 |
| 20-40 | 15 |
| 40-60 | 20 |
| 60-100 | 25 |
The above will be plotted as:
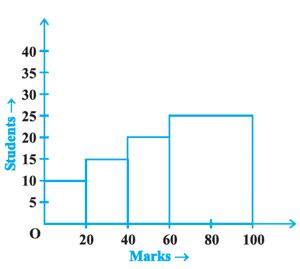
Hence, the given graph is correct.
View Full Answer(1)JEE Main high-scoring chapters and topics
Study 40% syllabus and score up to 100% marks in JEE

