
-
Engineering and Architecture
Exams
Colleges
Predictors
Resources
-
Computer Application and IT
Quick Links
Colleges
-
Pharmacy
Colleges
Resources
-
Hospitality and Tourism
Colleges
Resources
Diploma Colleges
-
Competition
Other Exams
Resources
-
School
Exams
Top Schools
Products & Resources
-
Study Abroad
Top Countries
Resources
-
Arts, Commerce & Sciences
Colleges
Upcoming Events
Resources
-
Management and Business Administration
Exams
Colleges & Courses
Predictors
-
Learn
Law Preparation
MBA Preparation
Engineering Preparation
Medical Preparation
-
Online Courses and Certifications
Top Streams
Specializations
- Digital Marketing Certification Courses
- Cyber Security Certification Courses
- Artificial Intelligence Certification Courses
- Business Analytics Certification Courses
- Data Science Certification Courses
- Cloud Computing Certification Courses
- Machine Learning Certification Courses
- View All Certification Courses
Resources
-
Medicine and Allied Sciences
Colleges
Predictors
Resources
-
Law
Resources
Colleges
-
Animation and Design
Exams
Predictors & Articles
Colleges
Resources
-
Media, Mass Communication and Journalism
Colleges
Resources
-
Finance & Accounts
Top Courses & Careers
Colleges
Get Answers to all your Questions


All Questions
Q.2 Draw a graph for the following.
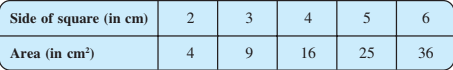
Is it a linear graph?

From above graph,we conclude that graph is not linear.
View Full Answer(1)Q.2 Draw a graph for the following. Is it a linear graph ?
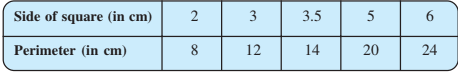

From the above graph ,we conclude that graph is linear.
View Full Answer(1)Crack CUET with india's "Best Teachers"
- HD Video Lectures
- Unlimited Mock Tests
- Faculty Support

Q.1 Given: Interest on deposits for a year .

To get an interest of Rs 280 per year how much money should be deposited ?

From the graph,to get an interest of Rs 280 per year Rs 3500 money should be deposited.
View Full Answer(1)
JEE Main high-scoring chapters and topics
Study 40% syllabus and score up to 100% marks in JEE
Q.1 Given: Interest on deposits for a year
Use the graph to find the interest on Rs 2500 for a year.
Using the graph, the interest on Rs 2500 for a year is Rs 200.
View Full Answer(1)Q.1Given the following information :
Interest on deposits for a year.
Does the graph pass through the origin?
Taking x axis as 1000 units = 1 box and y axis as 100 units = 1 box.
Yes, the graph pass through the origin.
View Full Answer(1)NEET 2024 Most scoring concepts
- Just Study 32% of the NEET syllabus and Score up to 100% marks
Q.1 Draw the graphs for the following tables of values, with suitable scales on the axes.
Distance travelled by a car.

What was the time when the car had covered a distance of 100 km since it’s start ?

From above graph we conclude that at 7:30 a.m., the car had covered a distance of 100 km since it’s start.
View Full Answer(1)Q.1 Draw the graphs for the following tables of values, with suitable scales on the graph. How much distance did the car cover during the period 7.30 a.m. to 8 a.m?
From the above graph,the distance the car cover during the period 7.30 a.m. to 8 a.m is
Crack CUET with india's "Best Teachers"
- HD Video Lectures
- Unlimited Mock Tests
- Faculty Support
Q.1 Draw the graphs for the following tables of values, with suitable scales on the axes.
Cost of apples
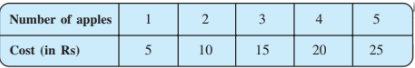
Cost of apples

Q. A bank gives 10% Simple Interest (S.I.) on deposits by senior citizens. Draw a graph to illustrate the relation between the sum deposited and simple interest earned. Find from your graph
a) The annual interest obtainable for an investment of Rs. 250.
b) The investment one has to make to get an annual simple interest of Rs. 70.
Taking a case of direct variation the graph is as shown below.
Taking sum deposit as 100,200,300,500 ,1000.
and 10% Simple Interest (S.I.).

a) The annual interest for an investment of Rs 250 is Rs 25.
b) The investment one has to make to get an annual simple interest of Rs 70 is Rs 700.
JEE Main high-scoring chapters and topics
Study 40% syllabus and score up to 100% marks in JEE

