
-
Engineering and Architecture
Exams
Colleges
Predictors
Resources
-
Computer Application and IT
Quick Links
Colleges
-
Pharmacy
Colleges
Resources
-
Hospitality and Tourism
Colleges
Resources
Diploma Colleges
-
Competition
Other Exams
Resources
-
School
Exams
Top Schools
Products & Resources
-
Study Abroad
Top Countries
Resources
-
Arts, Commerce & Sciences
Colleges
Upcoming Events
Resources
-
Management and Business Administration
Exams
Colleges & Courses
Predictors
-
Learn
Law Preparation
MBA Preparation
Engineering Preparation
Medical Preparation
-
Online Courses and Certifications
Top Streams
Specializations
- Digital Marketing Certification Courses
- Cyber Security Certification Courses
- Artificial Intelligence Certification Courses
- Business Analytics Certification Courses
- Data Science Certification Courses
- Cloud Computing Certification Courses
- Machine Learning Certification Courses
- View All Certification Courses
Resources
-
Medicine and Allied Sciences
Colleges
Predictors
Resources
-
Law
Resources
Colleges
-
Animation and Design
Exams
Predictors & Articles
Colleges
Resources
-
Media, Mass Communication and Journalism
Colleges
Resources
-
Finance & Accounts
Top Courses & Careers
Colleges
Get Answers to all your Questions


All Questions
Q. 1. What cross-sections do you get when you give a
(i) vertical cut (ii) horizontal cut
to the following solids?
(a) A brick (b) A round apple (c) A die (d) A circular pipe (e) An ice cream cone
a ) A brick
i )

A vertical cut gives a square or rectangular crossection
ii ) The horizontal cut gives rectangular crossection

b ) A round apple
In both, the case crossection will be circular in shape approximately

c) A die
both the cut will give a square shape

d ) A circular pipe
i ) A vertical cut will give a circular shape

ii ) The horizontal cut gives a rectangular shape

e ) An ice cream cone
i) The vertical cut gives a triangular shape

ii) The horizontal cut gives a circular shape

5. The sum and sum of squares corresponding to length (in cm) and weight
(in gm) of 50 plant products are given below:
Which is more varying, the length or weight?
For length x,
Mean,
We know, Variance,
We know, Standard Deviation =
C.V.(x) =
For weight y,
Mean,
Mean,
We know, Variance,
We know, Standard Deviation =
C.V.(y) =
Since C.V.(y) > C.V.(x)
Therefore, weight is more varying.
View Full Answer(1)Crack CUET with india's "Best Teachers"
- HD Video Lectures
- Unlimited Mock Tests
- Faculty Support

4. The following is the record of goals scored by team A in a football session:
| No. of goals scored | 0 | 1 | 2 | 3 | 4 |
| No. of matches | 1 | 9 | 7 | 5 | 3 |
For the team B, mean number of goals scored per match was 2 with a standard deviation goals. Find which team may be considered more consistent?
|
No. of goals scored |
Frequency |
|||
| 0 | 1 | 0 | 0 | 0 |
| 1 | 9 | 1 | 9 | 9 |
| 2 | 7 | 4 | 14 | 28 |
| 3 | 5 | 9 | 15 | 45 |
| 4 | 3 | 16 | 12 | 48 |
|
|
= 50 |
=130 |
For Team A,
Mean,
We know, Variance,
We know, Standard Deviation =
C.V.(A) =
For Team B,
Mean = 2
Standard deviation, = 1.25
C.V.(B) =
Since C.V. of firm B is more than C.V. of A.
Therefore, Team A is more consistent.
View Full Answer(1)
3. An analysis of monthly wages paid to workers in two firms A and B, belonging to the same industry, gives the following results:
| Firm A |
Firm B |
|
|
No. of wage earners |
|
|
|
Mean of monthly wages |
|
|
|
Variance of the distribution of wages |
|
(ii) Which firm, A or B, shows greater variability in individual wages?
Given, Variance of firm A = 100
Standard Deviation =
Again, Variance of firm B = 121
Standard Deviation =
Since , firm B has greater variability in individual wages.
JEE Main high-scoring chapters and topics
Study 40% syllabus and score up to 100% marks in JEE
3. An analysis of monthly wages paid to workers in two firms A and B, belonging to the same industry, gives the following results:
| Firm A |
Firm B |
|
|
No. of wage earners |
|
|
|
Mean of monthly wages |
|
|
|
Variance of the distribution of wages |
|
(i) Which firm A or B pays larger amount as monthly wages?
Given, Mean of monthly wages of firm A = 5253
Number of wage earners = 586
Total amount paid = 586 x 5253 = 30,78,258
Again, Mean of monthly wages of firm B = 5253
Number of wage earners = 648
Total amount paid = 648 x 5253 = 34,03,944
Hence firm B pays larger amount as monthly wages.
View Full Answer(1)2 From the prices of shares X and Y below, find out which is more stable in value:
| X | 35 | 54 | 52 | 53 | 56 | 58 | 52 | 50 | 51 | 49 |
| Y | 108 | 107 | 105 | 105 | 106 | 107 | 104 | 103 | 104 | 101 |
|
X( |
Y( |
|
|
| 35 | 108 | 1225 | 11664 |
| 54 | 107 | 2916 | 11449 |
| 52 | 105 | 2704 | 11025 |
| 53 | 105 | 2809 | 11025 |
| 56 | 106 | 8136 | 11236 |
| 58 | 107 | 3364 | 11449 |
| 52 | 104 | 2704 | 10816 |
| 50 | 103 | 2500 | 10609 |
| 51 | 104 | 2601 | 10816 |
| 49 | 101 | 2401 | 10201 |
| =510 |
= 1050 |
=26360 | =110290 |
For X,
Mean ,
Variance,
We know, Standard Deviation =
C.V.(X) =
Similarly, For Y,
Mean ,
Variance,
We know, Standard Deviation =
C.V.(Y) =
Since C.V.(Y) < C.V.(X)
Hence Y is more stable.
View Full Answer(1)NEET 2024 Most scoring concepts
- Just Study 32% of the NEET syllabus and Score up to 100% marks
1.From the data given below state which group is more variable, A or B?
| Marks | 10-20 | 20-30 | 30-40 | 40-50 | 50-60 | 60-70 | 70-80 |
| Group A | 9 | 17 | 32 | 33 | 40 | 10 | 9 |
| Group B | 10 | 20 | 30 | 25 | 43 | 15 | 7 |
The group having a higher coefficient of variation will be more variable.
Let the assumed mean, A = 45 and h = 10
For Group A
|
Marks |
Group A |
Midpoint |
|
|||
| 10-20 | 9 | 15 | -3 | 9 | -27 | 81 |
| 20-30 | 17 | 25 | -2 | 4 | -34 | 68 |
| 30-40 | 32 | 35 | -1 | 1 | -32 | 32 |
| 40-50 | 33 | 45 | 0 | 0 | 0 | 0 |
| 50-60 | 40 | 55 | 1 | 1 | 40 | 40 |
| 60-70 | 10 | 65 | 2 | 4 | 20 | 40 |
| 70-80 | 9 | 75 | 3 | 9 | 27 | 81 |
|
|
|
= -6 |
=342 |
Mean,
We know, Variance,
We know, Standard Deviation =
Coefficient of variation =
C.V.(A) =
Similarly,
For Group B
|
Marks |
Group A |
Midpoint |
|
|||
| 10-20 | 10 | 15 | -3 | 9 | -30 | 90 |
| 20-30 | 20 | 25 | -2 | 4 | -40 | 80 |
| 30-40 | 30 | 35 | -1 | 1 | -30 | 30 |
| 40-50 | 25 | 45 | 0 | 0 | 0 | 0 |
| 50-60 | 43 | 55 | 1 | 1 | 43 | 43 |
| 60-70 | 15 | 65 | 2 | 4 | 30 | 60 |
| 70-80 | 7 | 75 | 3 | 9 | 21 | 72 |
|
|
|
= -6 |
=375 |
Mean,
We know, Variance,
We know, Standard Deviation =
Coefficient of variation =
C.V.(B) =
Since C.V.(B) > C.V.(A)
Therefore, Group B is more variable.
View Full Answer(1)
Q.2 Draw a graph for the following.
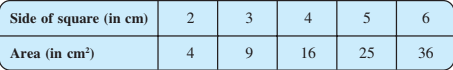
Is it a linear graph?

From above graph,we conclude that graph is not linear.
View Full Answer(1)Crack CUET with india's "Best Teachers"
- HD Video Lectures
- Unlimited Mock Tests
- Faculty Support
Q.2 Draw a graph for the following. Is it a linear graph ?
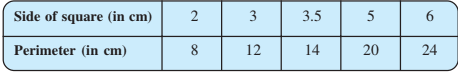

From the above graph ,we conclude that graph is linear.
View Full Answer(1)JEE Main high-scoring chapters and topics
Study 40% syllabus and score up to 100% marks in JEE

