
Browse by Stream
-
Engineering and Architecture
Exams
Colleges
Predictors
Resources
-
Computer Application and IT
Quick Links
Colleges
-
Pharmacy
Colleges
Resources
-
Hospitality and Tourism
Colleges
Resources
Diploma Colleges
-
Competition
Other Exams
Resources
-
School
Exams
Top Schools
Products & Resources
-
Study Abroad
Top Countries
Resources
-
Arts, Commerce & Sciences
Exams
Colleges
Upcoming Events
Resources
-
Management and Business Administration
Colleges & Courses
Predictors
-
Learn
Law Preparation
MBA Preparation
Engineering Preparation
Medical Preparation
-
Online Courses and Certifications
Top Streams
Specializations
- Digital Marketing Certification Courses
- Cyber Security Certification Courses
- Artificial Intelligence Certification Courses
- Business Analytics Certification Courses
- Data Science Certification Courses
- Cloud Computing Certification Courses
- Machine Learning Certification Courses
- View All Certification Courses
Resources
-
Medicine and Allied Sciences
Colleges
Predictors
Resources
-
Law
Resources
Colleges
-
Animation and Design
Exams
Predictors & Articles
Colleges
Resources
-
Media, Mass Communication and Journalism
Colleges
Resources
-
Finance & Accounts
Top Courses & Careers
Colleges
Get Answers to all your Questions


- Home
- Engineering
- Solve it, - Chemical Kinetics and Surface Chemistry - BITSAT
- #Chemical Kinetics and Surface Chemistry
- #Chemistry
- #Birla Institute of Technology & Science Admission Test
- #Engineering
A graph plotted between vs loga concn is a straight line. What conclusion can you drow from the given graph?
(n=order)
- Option 1)
- Option 2)
- Option 3)
- Option 4)
none
Answers (1)

As we leaned in concept
First Order Reaction -
The rate of the reaction is proportional to the first power of the concentration of the reaction
- wherein
Formula:
R P
a 0
a-x x
[differentiate rate law]
Unit of
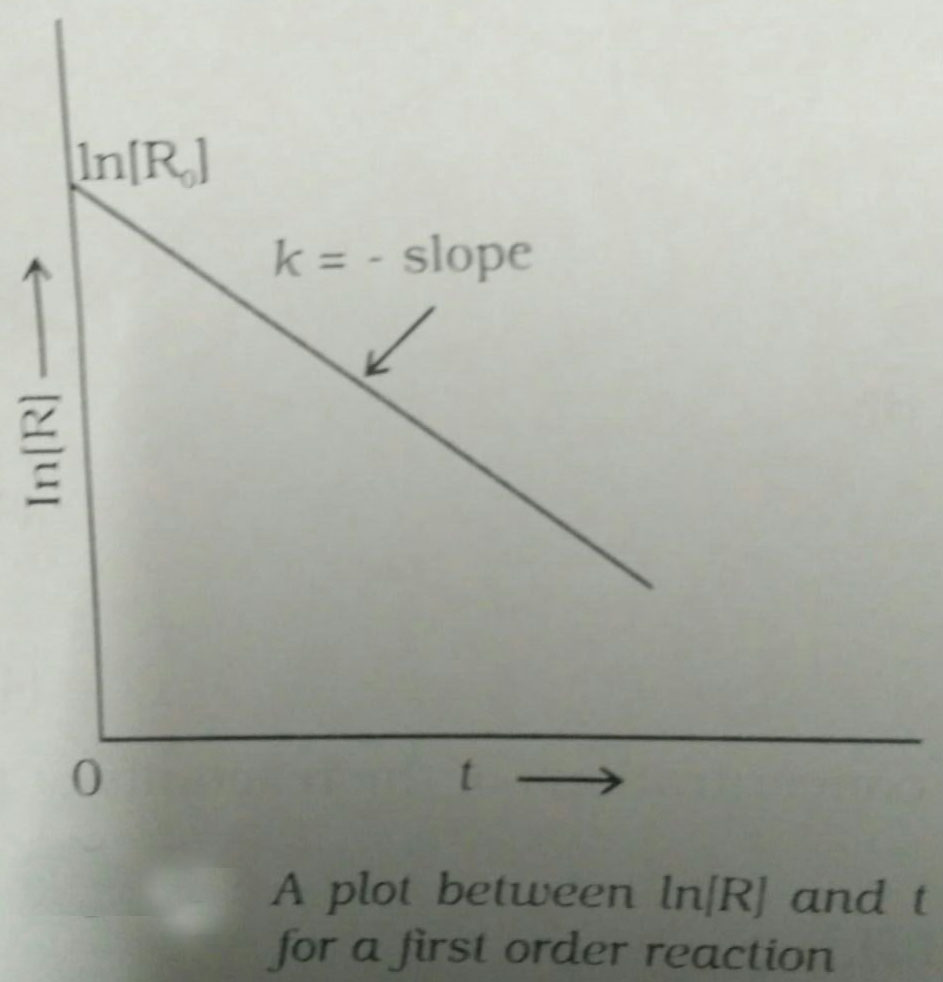
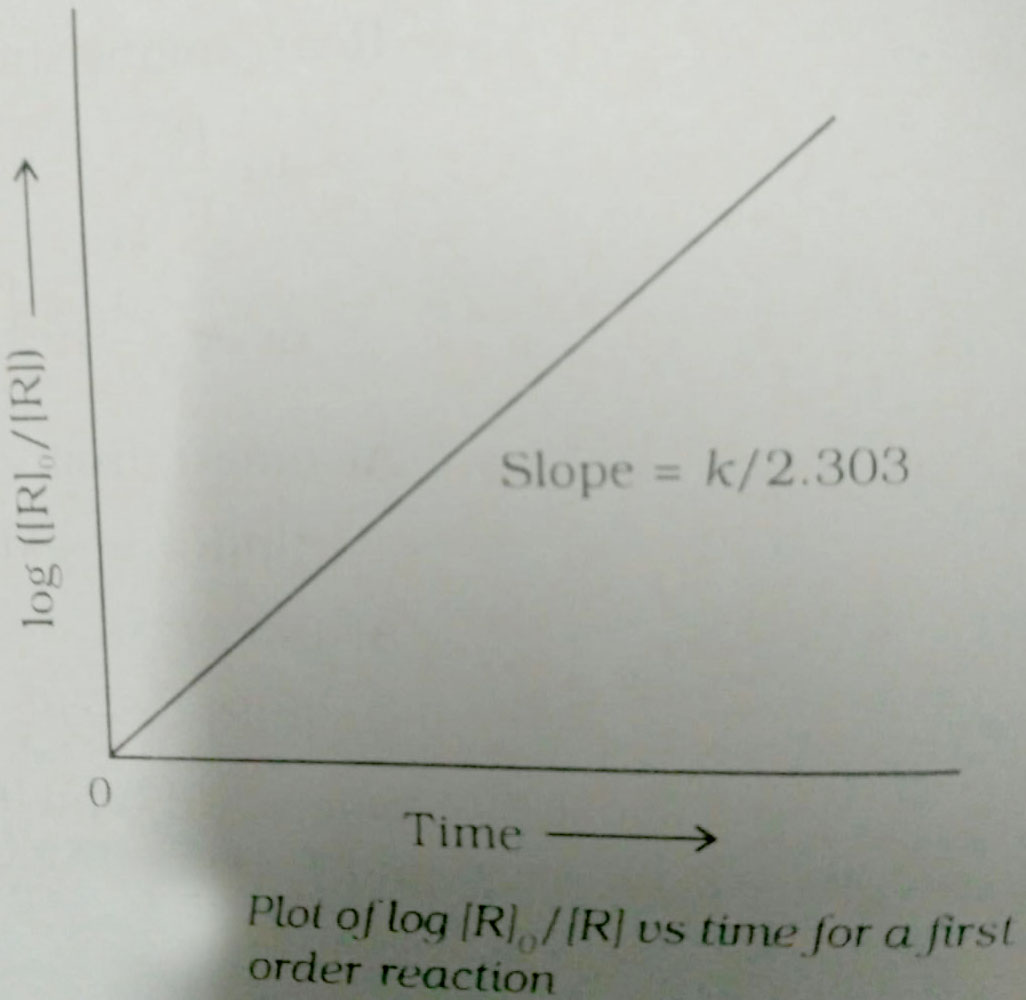
We know that for first order reactions,
So, in other words, in a first oder reaction, does not depend on the concentration.
Therefore, graphically we can draw.
n=1,
Option 1)
Incorrect option
Option 2)
Incorrect option
Option 3)
Correct option
Option 4)
none
Incorrect option
View full answer
Similar Questions
- 0.27 g of a long chain fatty acid was dissolved in 100 cm3 of hexane. 10 mL of this solution was added dropwise to the surface of water in a
- 0.3 g of acid is neutralised by 40 cm3 .125N NaOH .equvivalent mass of acid is
- 1. A block of mass 10 kg is kept on a rough inclined as shown in figure. The coefficient of friction between the block and the surface is 0

