
-
Engineering and Architecture
Exams
Colleges
Predictors
Resources
-
Computer Application and IT
Quick Links
Colleges
-
Pharmacy
Colleges
Resources
-
Hospitality and Tourism
Colleges
Resources
Diploma Colleges
-
Competition
Other Exams
Resources
-
School
Exams
Top Schools
Products & Resources
-
Study Abroad
Top Countries
Resources
-
Arts, Commerce & Sciences
Exams
Colleges
Upcoming Events
Resources
-
Management and Business Administration
Colleges & Courses
Predictors
-
Learn
Law Preparation
MBA Preparation
Engineering Preparation
Medical Preparation
-
Online Courses and Certifications
Top Streams
Specializations
- Digital Marketing Certification Courses
- Cyber Security Certification Courses
- Artificial Intelligence Certification Courses
- Business Analytics Certification Courses
- Data Science Certification Courses
- Cloud Computing Certification Courses
- Machine Learning Certification Courses
- View All Certification Courses
Resources
-
Medicine and Allied Sciences
Colleges
Predictors
Resources
-
Law
Resources
Colleges
-
Animation and Design
Exams
Predictors & Articles
Colleges
Resources
-
Media, Mass Communication and Journalism
Colleges
Resources
-
Finance & Accounts
Top Courses & Careers
Colleges
Get Answers to all your Questions


- Home
- Management
- Directions for question: The following bar-graph shows the percentage of employees working in different job profiles at M/S SPAN & Associates, a Kolkata based Audit f
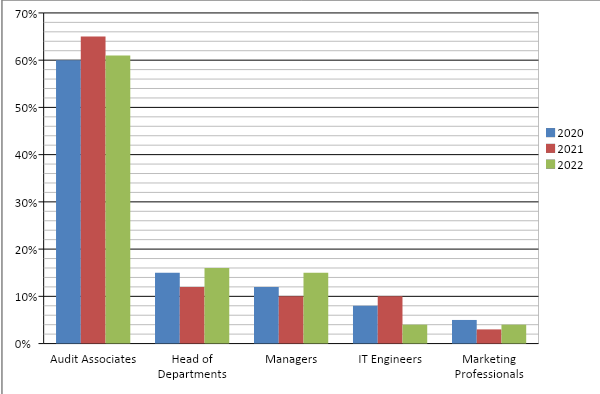
Directions for question:
The following bar-graph shows the percentage of employees working in different job profiles at M/S SPAN & Associates, a Kolkata based Audit firm over the three years – 2020, 2021 and 2022. These are the only job profiles available in the company.
Question:
Between 2020 and 2022, if the number of employees in the company increases by 10% every year over the previous year, what is the approximate difference in percentage points in the percentage change in the number of Head of Departments between 2020 and 2022 and the percentage change in the number of Managers between 2020 and 2022 ?
32.4
29.1
22.2
18.4
Answers (1)

Let the number of employees in 2017 be 1000.
Therefore, the number of employees in 2018 is 1100.
Also the number of employees in 2019 is 1210.
Hence we have:
|
2020 |
2021 |
% change |
|
|
Number of employees |
1000 |
1210 |
|
|
Head of departments |
15% of 1000 = 150 |
16% of 1210 = 193.6 |
(193.6–150)*100/150 = 29.07% |
|
Managers |
12% of 1000 = 120 |
15% 0f 1210 = 181.5 |
(181.5–120)*100/120 = 51.25% |
Therefore, the required percentage point difference = 51.25% – 29.07% = 22.2%.

