
Browse by Stream
-
Engineering and Architecture
Exams
Colleges
Predictors
Resources
-
Computer Application and IT
Quick Links
Colleges
-
Pharmacy
Colleges
Resources
-
Hospitality and Tourism
Colleges
Resources
Diploma Colleges
-
Competition
Other Exams
Resources
-
School
Exams
Top Schools
Products & Resources
-
Study Abroad
Top Countries
Resources
-
Arts, Commerce & Sciences
Colleges
Upcoming Events
Resources
-
Management and Business Administration
Exams
Colleges & Courses
Predictors
-
Learn
Law Preparation
MBA Preparation
Engineering Preparation
Medical Preparation
-
Online Courses and Certifications
Top Streams
Specializations
- Digital Marketing Certification Courses
- Cyber Security Certification Courses
- Artificial Intelligence Certification Courses
- Business Analytics Certification Courses
- Data Science Certification Courses
- Cloud Computing Certification Courses
- Machine Learning Certification Courses
- View All Certification Courses
Resources
-
Medicine and Allied Sciences
Colleges
Predictors
Resources
-
Law
Resources
Colleges
-
Animation and Design
Exams
Predictors & Articles
Colleges
Resources
-
Media, Mass Communication and Journalism
Colleges
Resources
-
Finance & Accounts
Top Courses & Careers
Colleges
Get Answers to all your Questions


- Home
- Engineering
- Solve! - Electromagnetic Induction and Alternating currents - BITSAT
- #Birla Institute of Technology & Science Admission Test
- #Engineering
- #AIIMS MBBS
- #Electromagnetic Induction and Alternating currents
- #Joint Entrance Examination Main
- #Physics
- #All India Pre Medical Test

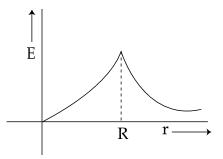
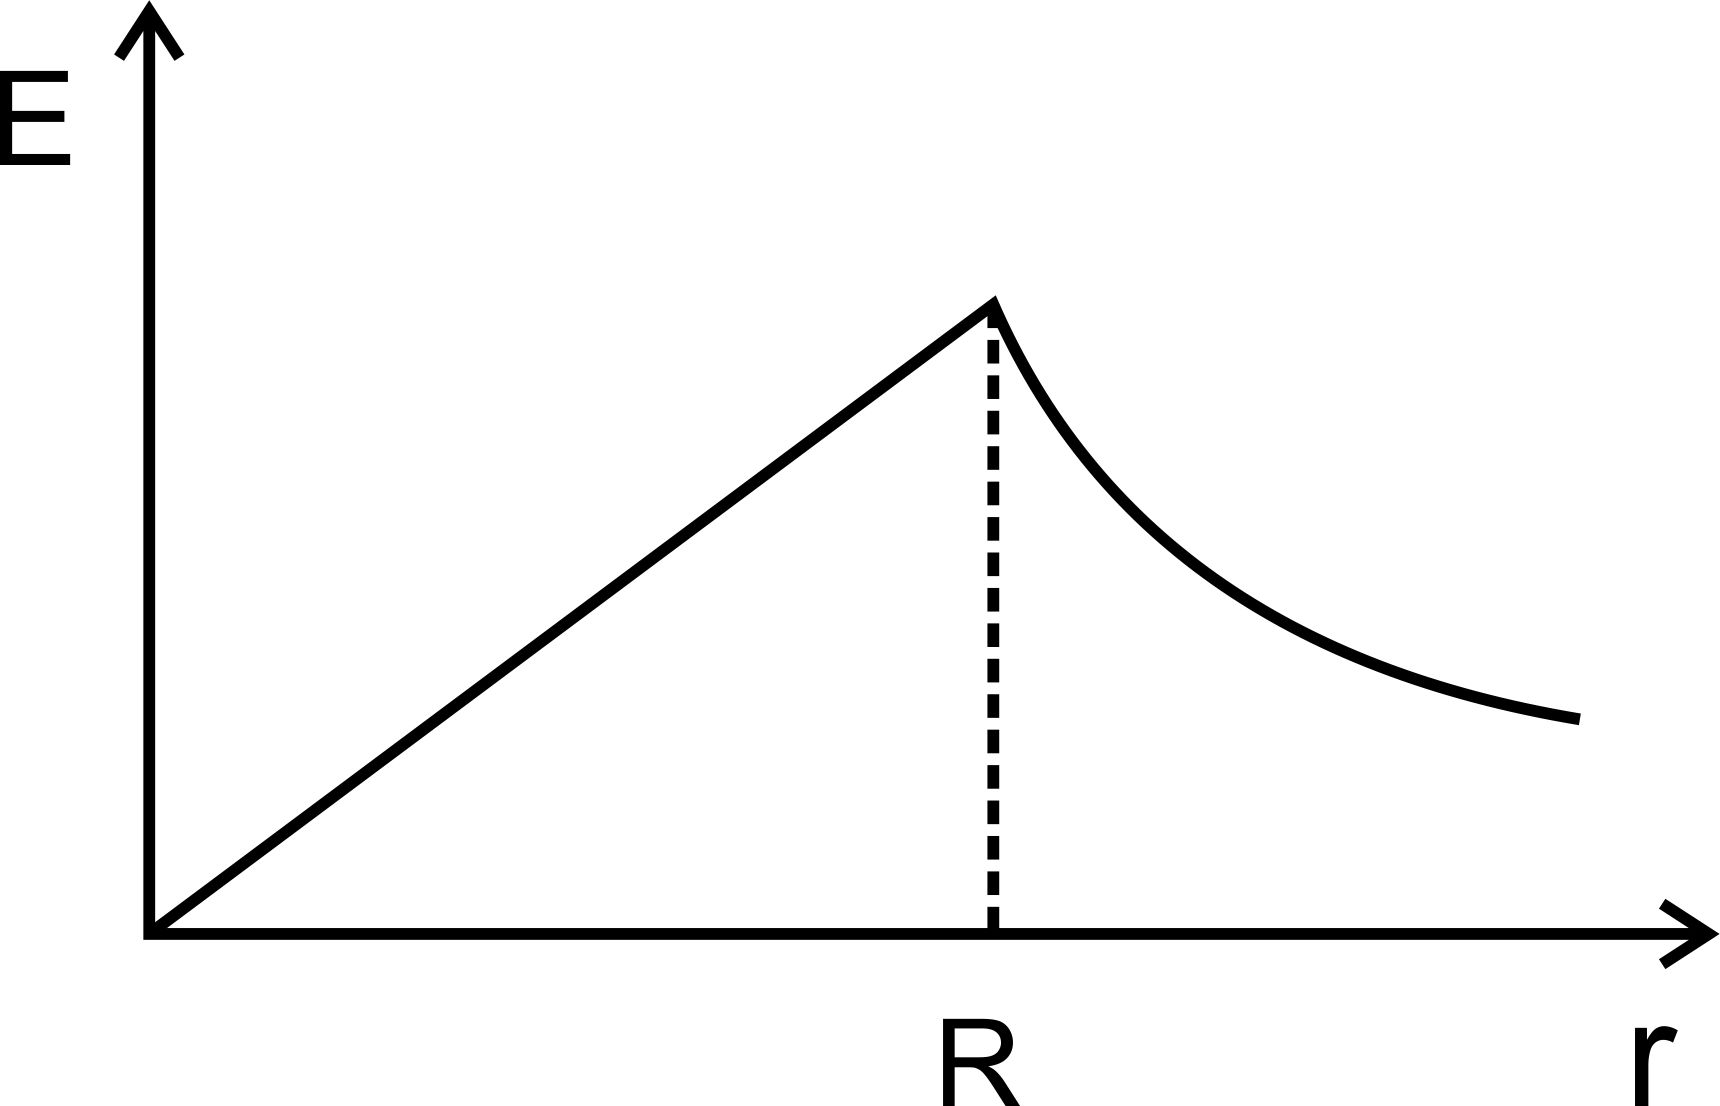
Figure shows a circular area of radius R where a uniform magnetic field is going into the plane of paper and increasing in magnitude at a constant rate. In that case, which of the following graphs, drawn schematically, correctly shows the variation of the induced electric field E(r) ?
- Option 1)

- Option 2)

- Option 3)

- Option 4)
Answers (1)

As we discussed in concept
Induced electric field -
When
A constant
B Varying
- wherein

Option 1)
Option 2)
Option 3)
Option 4)
View full answer
JEE Main high-scoring chapters and topics
Study 40% syllabus and score up to 100% marks in JEE

