
Browse by Stream
-
Engineering and Architecture
Exams
Colleges
Predictors
Resources
-
Computer Application and IT
Quick Links
Colleges
-
Pharmacy
Colleges
Resources
-
Hospitality and Tourism
Colleges
Resources
Diploma Colleges
-
Competition
Other Exams
Resources
-
School
Exams
Top Schools
Products & Resources
-
Study Abroad
Top Countries
Resources
-
Arts, Commerce & Sciences
Colleges
Upcoming Events
Resources
-
Management and Business Administration
Exams
Colleges & Courses
Predictors
-
Learn
Law Preparation
MBA Preparation
Engineering Preparation
Medical Preparation
-
Online Courses and Certifications
Top Streams
Specializations
- Digital Marketing Certification Courses
- Cyber Security Certification Courses
- Artificial Intelligence Certification Courses
- Business Analytics Certification Courses
- Data Science Certification Courses
- Cloud Computing Certification Courses
- Machine Learning Certification Courses
- View All Certification Courses
Resources
-
Medicine and Allied Sciences
Colleges
Predictors
Resources
-
Law
Resources
Colleges
-
Animation and Design
Exams
Predictors & Articles
Colleges
Resources
-
Media, Mass Communication and Journalism
Colleges
Resources
-
Finance & Accounts
Top Courses & Careers
Colleges
Get Answers to all your Questions


Liquid oxygen at 450 K is heated to 3000 K at a constant pressure of 1 atm . The rate of heating is constant . Which one of the following graph represents the variation of temprature with time
Option: 1

Option: 2

Option: 3

Option: 4

Answers (1)

As we have learned
Phase -
We use term phase to describe a specific state of water. Such as solid liquid or gas.
- wherein
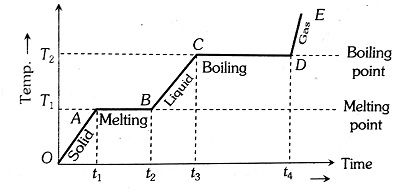
At first temprature will increase then there will be state change from liquid to gas.
The correct graph is represented by
View full answer
NEET 2024 Most scoring concepts
- Just Study 32% of the NEET syllabus and Score up to 100% marks

