
-
Engineering and Architecture
Exams
Colleges
Predictors
Resources
-
Computer Application and IT
Quick Links
Colleges
-
Pharmacy
Colleges
Resources
-
Hospitality and Tourism
Colleges
Resources
Diploma Colleges
-
Competition
Other Exams
Resources
-
School
Exams
Top Schools
Products & Resources
-
Study Abroad
Top Countries
Resources
-
Arts, Commerce & Sciences
Colleges
Upcoming Events
Resources
-
Management and Business Administration
Exams
Colleges & Courses
Predictors
-
Learn
Law Preparation
MBA Preparation
Engineering Preparation
Medical Preparation
-
Online Courses and Certifications
Top Streams
Specializations
- Digital Marketing Certification Courses
- Cyber Security Certification Courses
- Artificial Intelligence Certification Courses
- Business Analytics Certification Courses
- Data Science Certification Courses
- Cloud Computing Certification Courses
- Machine Learning Certification Courses
- View All Certification Courses
Resources
-
Medicine and Allied Sciences
Colleges
Predictors
Resources
-
Law
Resources
Colleges
-
Animation and Design
Exams
Predictors & Articles
Colleges
Resources
-
Media, Mass Communication and Journalism
Colleges
Resources
-
Finance & Accounts
Top Courses & Careers
Colleges
Get Answers to all your Questions


- #Class 11
- #Medical
- #Cell Structure and Function
- #National Eligibility Cum Entrance Test
- #Biology
- #National Eligilibility Cum Entrance Test
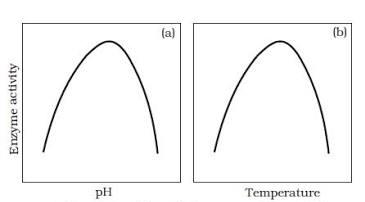
The curve given below shows enzymatic activity in relation to three conditions . pH , temprature and substrate concentration . What do the two axis (x and y) represent
 ?
?
x-axis y-axis
Enzymatic activity pH
x-axis y-axis
Temprature Enzymatic activity
x-axis y-axis
Substrate concentration Enzymatic activity
x-axis y-axis
Enzymatic activity Temprature
Answers (1)

As we have learned
Optimum Temperature and optimum pH of an enzyme -
Enzymes generally function in a narrow range of temperature and pH. Each enzyme show its highest activity at a particular temperature and pH called the optimum temperature and pH
- wherein
NEET 2024 Most scoring concepts
- Just Study 32% of the NEET syllabus and Score up to 100% marks

