-
Engineering and Architecture
Exams
Colleges
Predictors
Resources
-
Computer Application and IT
Quick Links
Colleges
-
Pharmacy
Colleges
Resources
-
Hospitality and Tourism
Colleges
Resources
Diploma Colleges
-
Competition
Other Exams
Resources
-
School
Exams
Top Schools
Products & Resources
-
Study Abroad
Top Countries
Resources
-
Arts, Commerce & Sciences
Colleges
Upcoming Events
Resources
-
Management and Business Administration
Exams
Colleges & Courses
Predictors
-
Learn
Law Preparation
MBA Preparation
Engineering Preparation
Medical Preparation
-
Online Courses and Certifications
Top Streams
Specializations
- Digital Marketing Certification Courses
- Cyber Security Certification Courses
- Artificial Intelligence Certification Courses
- Business Analytics Certification Courses
- Data Science Certification Courses
- Cloud Computing Certification Courses
- Machine Learning Certification Courses
- View All Certification Courses
Resources
-
Medicine and Allied Sciences
Colleges
Predictors
Resources
-
Law
Resources
Colleges
-
Animation and Design
Exams
Predictors & Articles
Colleges
Resources
-
Media, Mass Communication and Journalism
Colleges
Resources
-
Finance & Accounts
Top Courses & Careers
Colleges
Get Answers to all your Questions


Plot a graph showing variation of de-Broglie wavelength associated with a charged particle mass
, versus
,
Where is the potential difference through which the particle is accelerated. How does this graph give us the information regarding the magnitude of the charge of the particle
Answers (1)
Let us consider a particle of charge and mass
To gain speed and kinetic energy
Let it be accelerated by a potential difference
Thus,
Now, on Rearranging the expression, we have
The de-Broglie wavelength equation :-
On substituting the value of we have
Now, we know the equation of straight line.-
Where
is the shape of the line.
Hence, on plotting the graph of vs
.
We will have a straight line with a slope.
On rearranging, we have
The graph of vs
. Can be drawn as :
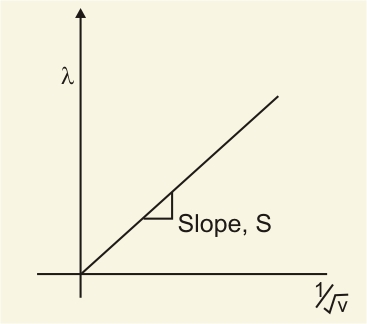
Hence, we can determine from the graph, and this graph gives us the information regarding the magnitude of the charge of the particle.
Crack CUET with india's "Best Teachers"
- HD Video Lectures
- Unlimited Mock Tests
- Faculty Support