
-
Engineering and Architecture
Exams
Colleges
Predictors
Resources
-
Computer Application and IT
Quick Links
Colleges
-
Pharmacy
Colleges
Resources
-
Hospitality and Tourism
Colleges
Resources
Diploma Colleges
-
Competition
Other Exams
Resources
-
School
Exams
Top Schools
Products & Resources
-
Study Abroad
Top Countries
Resources
-
Arts, Commerce & Sciences
Colleges
Upcoming Events
Resources
-
Management and Business Administration
Exams
Colleges & Courses
Predictors
-
Learn
Law Preparation
MBA Preparation
Engineering Preparation
Medical Preparation
-
Online Courses and Certifications
Top Streams
Specializations
- Digital Marketing Certification Courses
- Cyber Security Certification Courses
- Artificial Intelligence Certification Courses
- Business Analytics Certification Courses
- Data Science Certification Courses
- Cloud Computing Certification Courses
- Machine Learning Certification Courses
- View All Certification Courses
Resources
-
Medicine and Allied Sciences
Colleges
Predictors
Resources
-
Law
Resources
Colleges
-
Animation and Design
Exams
Predictors & Articles
Colleges
Resources
-
Media, Mass Communication and Journalism
Colleges
Resources
-
Finance & Accounts
Top Courses & Careers
Colleges
Get Answers to all your Questions


- Home
- Engineering
- In an RC circuit while charging, the graph of in i versus time is as shown by the dotted line in the diagram figure, where i is the current. When the value of the resistance is doubled, which of th
- #Joint Entrance Examination Main
- #Electromagnetic Induction and Alternating currents
- #Physics
- #Engineering
- #Class 12
In an RC circuit while charging, the graph of in i versus time is as shown by the dotted line in the diagram figure, where i is the current. When the value of the resistance is doubled, which of the solid curve best represents the variation of in i versus time?
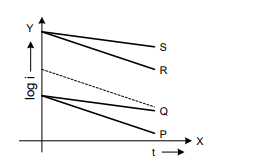
P
Q
R
S
Answers (1)

When R is doubled, the slope of the curve increases. Further at t = 0, the current will be less for an increased value of resistance
JEE Main high-scoring chapters and topics
Study 40% syllabus and score up to 100% marks in JEE
Similar Questions
-
5 g of Na2SO4 was dissolved in x g of H2O. The change in freezing point was found to be 3.820C. If Na2SO4 is 81.5% ionised, the value of x (K

A capacitor is made of two square plates each of side 'a' making a very small angle
-
A solution of m-chloroaniline, m-chlorophenol and m-chlorobenzoic acid in ethyl acetate was extracted initially with a saturated solution of NaHCO3 to give fraction A. The leftover organic phase was extracted with d

