
-
Engineering and Architecture
Exams
Colleges
Predictors
Resources
-
Computer Application and IT
Quick Links
Colleges
-
Pharmacy
Colleges
Resources
-
Hospitality and Tourism
Colleges
Resources
Diploma Colleges
-
Competition
Other Exams
Resources
-
School
Exams
Top Schools
Products & Resources
-
Study Abroad
Top Countries
Resources
-
Arts, Commerce & Sciences
Colleges
Upcoming Events
Resources
-
Management and Business Administration
Exams
Colleges & Courses
Predictors
-
Learn
Law Preparation
MBA Preparation
Engineering Preparation
Medical Preparation
-
Online Courses and Certifications
Top Streams
Specializations
- Digital Marketing Certification Courses
- Cyber Security Certification Courses
- Artificial Intelligence Certification Courses
- Business Analytics Certification Courses
- Data Science Certification Courses
- Cloud Computing Certification Courses
- Machine Learning Certification Courses
- View All Certification Courses
Resources
-
Medicine and Allied Sciences
Colleges
Predictors
Resources
-
Law
Resources
Colleges
-
Animation and Design
Exams
Predictors & Articles
Colleges
Resources
-
Media, Mass Communication and Journalism
Colleges
Resources
-
Finance & Accounts
Top Courses & Careers
Colleges
Get Answers to all your Questions


- Home
- Engineering
- The given figure represents the displacement of a particle as a function of time. Based on the figure, we can conclude that: <img alt="" src="https://cdn.entrance360.com/media/uploads/202
The given figure represents the displacement of a particle as a function of time. Based on the figure, we can conclude that:
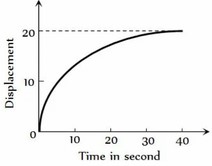
The particle initially starts with a certain velocity, but its motion is decelerated, eventually coming to a stop.
The velocity of the particle remains constant throughout.
The acceleration of the particle remains constant throughout.
The particle begins with a constant velocity, then experiences acceleration, and finally moves with another constant velocity.
Answers (1)

The decreasing slope of the displacement-time graph indicates that the velocity of the particle is decreasing. This decreasing slope signifies that the particle's motion is decelerated or "retarded." As the slope continues to decrease, eventually reaching zero, it indicates that the particle comes to a complete stop.
JEE Main high-scoring chapters and topics
Study 40% syllabus and score up to 100% marks in JEE

