
Browse by Stream
-
Engineering and Architecture
Exams
Colleges
Predictors
Resources
-
Computer Application and IT
Quick Links
Colleges
-
Pharmacy
Colleges
Resources
-
Hospitality and Tourism
Colleges
Resources
Diploma Colleges
-
Competition
Other Exams
Resources
-
School
Exams
Top Schools
Products & Resources
-
Study Abroad
Top Countries
Resources
-
Arts, Commerce & Sciences
Colleges
Upcoming Events
Resources
-
Management and Business Administration
Exams
Colleges & Courses
Predictors
-
Learn
Law Preparation
MBA Preparation
Engineering Preparation
Medical Preparation
-
Online Courses and Certifications
Top Streams
Specializations
- Digital Marketing Certification Courses
- Cyber Security Certification Courses
- Artificial Intelligence Certification Courses
- Business Analytics Certification Courses
- Data Science Certification Courses
- Cloud Computing Certification Courses
- Machine Learning Certification Courses
- View All Certification Courses
Resources
-
Medicine and Allied Sciences
Colleges
Predictors
Resources
-
Law
Resources
Colleges
-
Animation and Design
Exams
Predictors & Articles
Colleges
Resources
-
Media, Mass Communication and Journalism
Colleges
Resources
-
Finance & Accounts
Top Courses & Careers
Colleges
Get Answers to all your Questions


- #Medical
- #Jawaharlal Institute of Postgraduate Medical Education Research MBBS
- #Class 12
- #Ecology and environment
- #Biology
Study the population growth curves (A and B) in the given graph and select the incorrect option.

Option: 1
Curve 'A' shows exponential growth, represented by equation
Option: 2
curve 'B' shows logistic growth, represented by equation
Option: 3
Exponential growth curve is considered as more realistic than the logistic growth curve
Option: 4
Curve 'A' can also be represented by equation
Answers (1)

As we learnt
Graph of Exponential Growth -
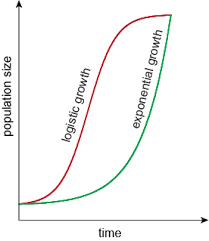
Graph of logistic growth is considered more realistic than the exponential growth considers those environmental limits that are density, food abundance,resting place, sickness, parasites, competition. It tells us that the population has a limit because of those environmental factors.
View full answer
