
-
Engineering and Architecture
Exams
Colleges
Predictors
Resources
-
Computer Application and IT
Quick Links
Colleges
-
Pharmacy
Colleges
Resources
-
Hospitality and Tourism
Colleges
Resources
Diploma Colleges
-
Competition
Other Exams
Resources
-
School
Exams
Top Schools
Products & Resources
-
Study Abroad
Top Countries
Resources
-
Arts, Commerce & Sciences
Colleges
Upcoming Events
Resources
-
Management and Business Administration
Exams
Colleges & Courses
Predictors
-
Learn
Law Preparation
MBA Preparation
Engineering Preparation
Medical Preparation
-
Online Courses and Certifications
Top Streams
Specializations
- Digital Marketing Certification Courses
- Cyber Security Certification Courses
- Artificial Intelligence Certification Courses
- Business Analytics Certification Courses
- Data Science Certification Courses
- Cloud Computing Certification Courses
- Machine Learning Certification Courses
- View All Certification Courses
Resources
-
Medicine and Allied Sciences
Colleges
Predictors
Resources
-
Law
Resources
Colleges
-
Animation and Design
Exams
Predictors & Articles
Colleges
Resources
-
Media, Mass Communication and Journalism
Colleges
Resources
-
Finance & Accounts
Top Courses & Careers
Colleges
Get Answers to all your Questions


- #Reproduction
- #Biology
- #National Eligilibility Cum Entrance Test
- #National Eligibility Cum Entrance Test
- #Class 12
- #Medical
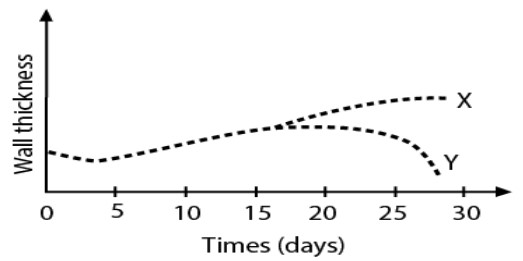
Based on the provided graph, which depicts the changes in the thickening of the uterine wall for two women labeled as X and Y over a one-month period, what conclusion can be drawn from this data?
Woman Y is undergoing menopause
Woman X has conceived
Both women X and Y will undergo menarche in the next month
Both A and B
Answers (1)

In the absence of fertilization after ovulation, which typically occurs around the 14th day of the menstrual cycle, the uterine lining is shed as menses during a 28-day cycle. However, if the egg is fertilized, the uterine lining undergoes growth to support the development of the embryo. Based on the provided diagram, it can be observed that the uterine wall thickness of woman Y begins to decrease after the 14th day. This indicates that the egg has not been fertilized, and she is experiencing the shedding of the uterine lining as part of her menstrual cycle. On the other hand, the uterine wall thickness of woman X shows an increase in thickness. This suggests that the egg has been fertilized, and she has conceived. The growth of the uterine lining is occurring to support the development of the embryo. Therefore, the rephrased conclusion is that woman Y's uterine wall thickness decreases after the 14th day, indicating non-fertilization of the egg, while woman X's uterine wall thickness increases, indicating successful fertilization and conception.
Hence, the correct answer is option 2.
NEET 2024 Most scoring concepts
- Just Study 32% of the NEET syllabus and Score up to 100% marks

