
Browse by Stream
-
Engineering and Architecture
Exams
Colleges
Predictors
Resources
-
Computer Application and IT
Quick Links
Colleges
-
Pharmacy
Colleges
Resources
-
Hospitality and Tourism
Colleges
Resources
Diploma Colleges
-
Competition
Other Exams
Resources
-
School
Exams
Top Schools
Products & Resources
-
Study Abroad
Top Countries
Resources
-
Arts, Commerce & Sciences
Colleges
Upcoming Events
Resources
-
Management and Business Administration
Exams
Colleges & Courses
Predictors
-
Learn
Law Preparation
MBA Preparation
Engineering Preparation
Medical Preparation
-
Online Courses and Certifications
Top Streams
Specializations
- Digital Marketing Certification Courses
- Cyber Security Certification Courses
- Artificial Intelligence Certification Courses
- Business Analytics Certification Courses
- Data Science Certification Courses
- Cloud Computing Certification Courses
- Machine Learning Certification Courses
- View All Certification Courses
Resources
-
Medicine and Allied Sciences
Colleges
Predictors
Resources
-
Law
Resources
Colleges
-
Animation and Design
Exams
Predictors & Articles
Colleges
Resources
-
Media, Mass Communication and Journalism
Colleges
Resources
-
Finance & Accounts
Top Courses & Careers
Colleges
Get Answers to all your Questions


- #Thermodynamics
- #Physics
- #Class 11
- #National Eligibility Cum Entrance Test
- #National Eligilibility Cum Entrance Test
- #Medical
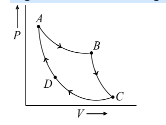
Figure is the P − V diagram for a Carnot cycle. In this diagram,
Option: 1
Curve DA represents isothermal process and BC adiabatic process
Option: 2
Curve AB represents adiabatic process and BC isothermal process
Option: 3
Curve CD represents isothermal process and DA adiabatic process
Option: 4
Curve CD represents adiabatic process and DA isothermal process
Answers (1)

For adiabatic process, constant. Differentiating w.r.t V we get
For isothermal process, PV = constant. Hence
Now, dP/dV is the slope of the (P − V)graph. Thus the slope of the (P − V) graph for an
adiabatic process is γ times that for an isothermal process. Hence curves BC and DA
both represent adiabatic process and curves AB and CD both represent isothermal
process.
View full answer
NEET 2024 Most scoring concepts
- Just Study 32% of the NEET syllabus and Score up to 100% marks

